Arizmic Education
Learn how systematic strategies are built.
Start with the foundations, understand what signals measure, then explore how research choices turn an idea into a strategy.
01 · Build the foundations
Learn the mechanics behind the result.
Understand returns, risk, backtests, validation, uncertainty, and portfolio evidence where they change a decision.
02 · Understand the signals
See what shipped signals actually measure.
Compare outputs, data requirements, useful roles, and the false interpretations that turn indicators into stories.
03 · Explore strategies
Choose a family to see how an idea becomes a complete rule.
Each family explains the behavior being tested, the decisions that define the strategy, and the evidence that would weaken it.
Trend & Momentum
Price movement can persist across a chosen horizon, but the rule succeeds or fails through its timing, exits, sizing, and tolerance for whipsaw.
- Lookback and decision horizon
- Long/flat or long/short exposure
- Whipsaw, cost, and volatility control
Mean Reversion
A price, spread, or normalized deviation may return toward an anchor, provided the anchor still represents the state being traded.
- Anchor and normalization
- Entry distance and holding horizon
- Exit, stop, and relationship-break rules
Breakouts & Volatility
A market leaving a well-defined range can reveal a change in participation, but range choice and confirmation determine whether the rule captures expansion or noise.
- Range and compression definition
- Close, touch, or retest confirmation
- Failure exit and volatility sizing
Session & Seasonality
Sessions concentrate information, liquidity, and positioning in repeatable windows, while calendar patterns demand especially strict controls for selection and decay.
- Session boundary and reference window
- Break, fade, or transition behavior
- Timezone, holiday, and selection controls
Relative Value & Factors
Relative strategies compare assets rather than forecasting each one in isolation, turning a signal into a portfolio only after universe, neutralization, and weighting choices.
- Universe and comparable peer set
- Ranking, neutralization, and rebalance
- Turnover, crowding, and factor exposure
Order Flow & Auction
Volume, aggressor flow, footprint structure, and auction references can describe how a move is being accepted or rejected, but none is a trade rule without context and timing.
- Data fidelity and aggressor classification
- Confirmation versus entry trigger
- Level, session, and invalidation context
Portfolios & Multi-Strategy
Portfolio design allocates risk across imperfect forecasts; the central problem is deciding which relationships are stable enough to influence weights.
- Overlap and diversification objective
- Risk estimate and weighting rule
- Constraints, turnover, and stress behavior
Market Making
A market maker repeatedly quotes both sides and manages the risk that fills accumulate inventory or arrive just before adverse price moves.
- Quote placement and spread
- Inventory limits and skew
- Queue, fill, and toxicity assumptions
From market data
See the concept in an actual return path.
These selected historical examples use reproducible public research data. Each guide states the window, construction, limitations, and why the example is illustrative rather than proof.
Selected historical example
Pairs trading: spreads, cointegration, and relationship breaks
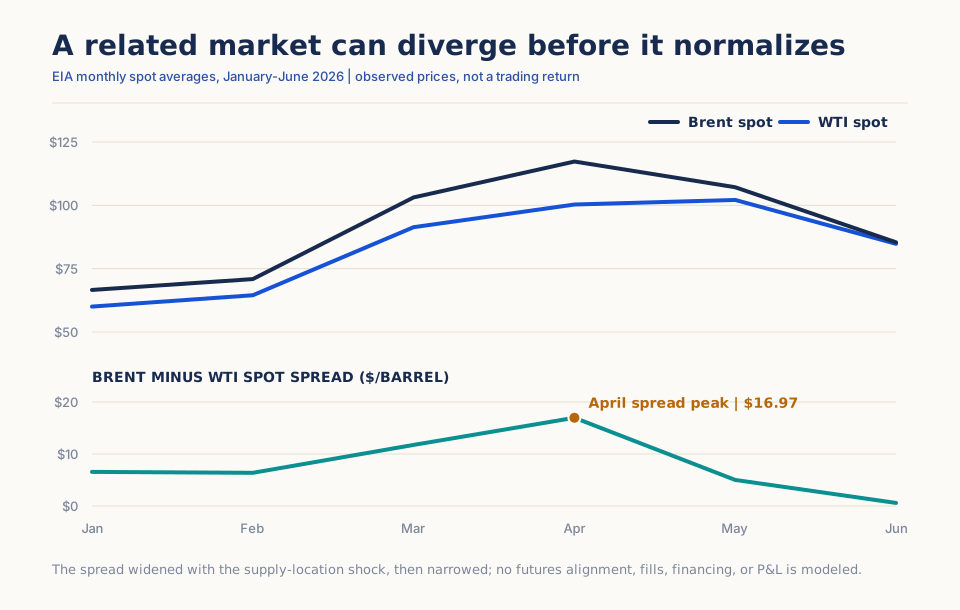
Brent and West Texas Intermediate (WTI) are related crude oil benchmarks, but they are exposed to different delivery locations, transport constraints, inventories, and regional supply shocks. Following military escalation in the Middle East on February 28, 2026, delivery-aligned Brent futures rose faster than WTI as Strait of Hormuz disruption affected internationally traded barrels while strong US inventories and planned reserve releases limited WTI.
Read the case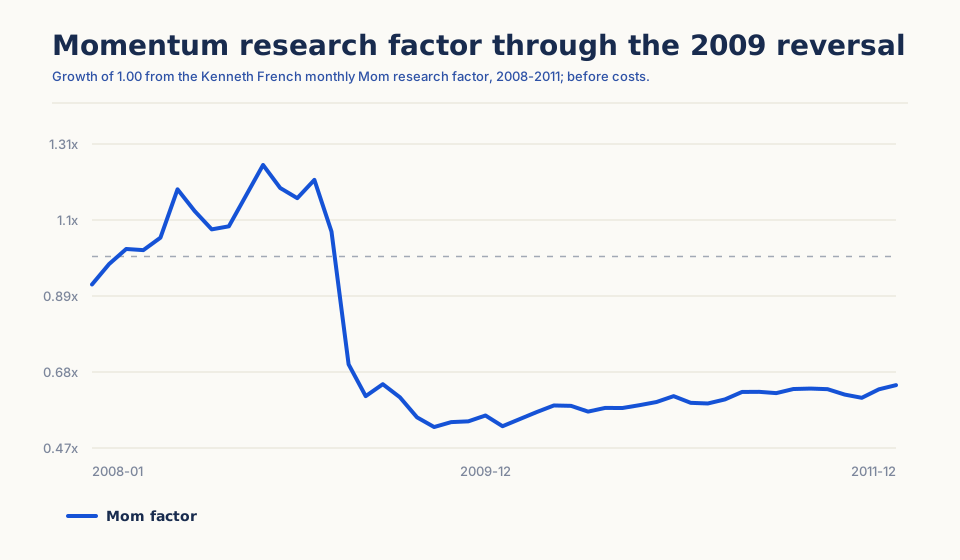
Selected historical example
Cross-sectional momentum
A published monthly US momentum research factor is constructed from six value-weight portfolios. It ranks NYSE, AMEX, and NASDAQ stocks by prior month 2–12 return, then subtracts the average return of the low prior-return portfolios from the high prior-return portfolios. Its declared construction specifies the six portfolios, breakpoints, and eligible exchanges.
Read the case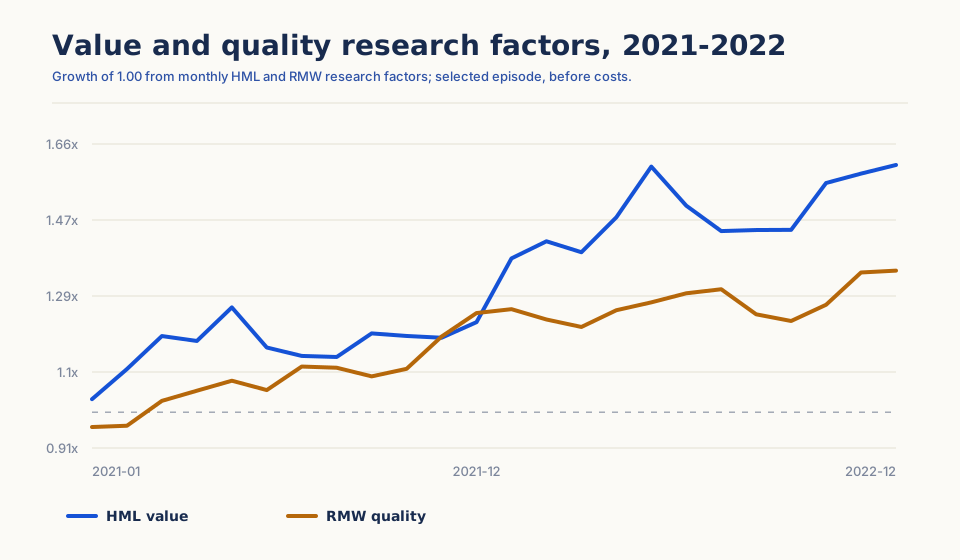
Selected historical example
Value and quality factors
Published HML and RMW research factors represent high-book-to-market minus low-book-to-market and robust-profitability minus weak-profitability portfolios. Both are constructed from transparent US equity sorts rather than from a single security.
Read the case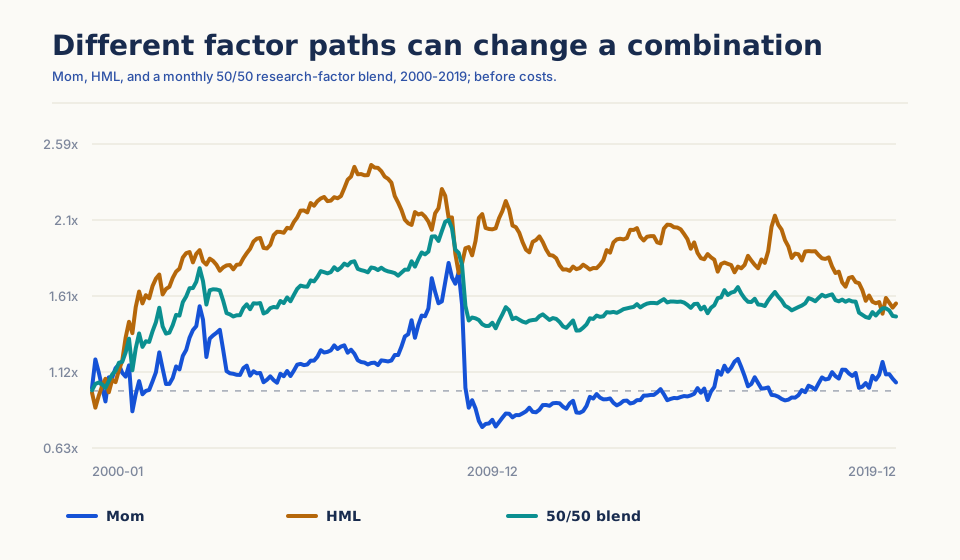
Selected historical example
Combining strategies: overlap, correlation, and diversification
Published US HML value and Mom momentum research series provide a reproducible illustration of differently behaving factors. For each month from January 2000 through December 2019, an illustrative blend allocates half to the published HML return and half to the published Mom return, then compounds the blended monthly result.
Read the case