A momentum oscillator summarizes how a recent move is behaving
Momentum is the tendency of a price move to continue in its current direction. An oscillator does not observe that tendency directly. It transforms a chosen slice of price history into a compact reading about change, speed, gain-loss balance, or location within a range.
It is called an oscillator because the transformed value rises and falls around a reference scale rather than tracing price itself. Some oscillators move around zero, some are bounded between fixed limits such as 0 and 100, and some are unbounded but interpreted relative to a center. The scale determines what a level means, so the number cannot be read without knowing the calculation.
The result is always conditional on the calculation. A ten-bar Rate of Change answers a different horizon from a fifty-bar version. A stochastic oscillator can sit near the top of its range even when the percentage return is small. Two oscillators can therefore disagree without either calculation being wrong.
Oscillators are also different from trend filters. A trend filter usually asks where price sits relative to a smoothed reference or which direction that reference points. An oscillator asks how forceful, extended, recent, or range-bound the move appears. Price can remain above a rising moving average while a momentum oscillator falls because the advance is continuing at a slower pace.
Most oscillator mistakes come from turning a description into a prediction. “RSI is 75” describes the balance of gains and losses under one lookback and smoothing convention. It does not say that price must fall, that it will keep rising, or that 75 represents a probability.
Six different measurements sit inside the family
Each type should be read on its own terms:
| Measurement type | Shipped examples | What it asks |
|---|---|---|
| Return over a lookback | Rate of Change, Cumulative Return | How far has price moved from the selected starting point? |
| Speed and change in speed | Momentum velocity and acceleration | How quickly is price changing, and is that change strengthening or weakening? |
| Gain-loss balance | Simple-Moving-Average Relative Strength Index | Have recent gains or recent losses contributed more magnitude? |
| Position inside a recent range | Stochastic Oscillator, Williams Percent Range | Is the close near the high, middle, or low of the selected high-low range? |
| Difference between smoothed horizons | Moving Average Convergence Divergence | How far apart are fast and slow exponential averages, and is that separation changing? |
| Standardized displacement or state | Commodity Channel Index, Oscillator Regime | How unusual is price relative to a rolling reference, or which threshold-defined state is active? |
These are not merely alternative scales for the same fact. Rate of Change uses two price endpoints. Relative Strength Index compares average gains with average losses. Stochastic and Williams %R depend on the high-low range. Commodity Channel Index uses typical price and its mean deviation. Moving Average Convergence Divergence compares smoothed horizons. Each calculation can retain or discard different information from the same path.
One advance can produce several different readings
Illustrative sequence. Imagine price advances from 100 to 108 over several bars, then continues to close near 108 without making much additional progress.
| Signal type | Possible reading | Plain-language interpretation |
|---|---|---|
| Rate of Change | Remains positive | Price is still above the lookback's starting point |
| Velocity and acceleration | Velocity stays positive while acceleration weakens | The move remains up, but its pace is no longer increasing |
| Relative Strength Index | Can remain elevated | Gains still dominate the selected window even though the latest bars have slowed |
| Stochastic or Williams %R | Can remain near the range high | Price is still closing near the top of its recent range |
| MACD histogram | Can shrink while MACD remains positive | The fast average is still above the slow average, but their separation is growing more slowly |
| Commodity Channel Index | Can move back toward zero | Price is becoming less displaced from its evolving reference |
The readings differ because the questions differ. None of them, alone, tells the reader whether the pause will become continuation or reversal.
Read the level, transition, duration, and direction separately
An oscillator produces a value, but a strategy often acts on a derived event. Those layers should not be collapsed:
- Level: the current value, such as RSI at 75 or Rate of Change at +4%.
- Change: whether the value is rising, falling, or accelerating.
- Transition: a one-observation event such as crossing above a threshold.
- Duration: how long the oscillator has remained inside a declared state.
- Divergence: disagreement between a defined price extreme and a defined oscillator extreme.
For MACD, positive MACD, a cross above its signal line, and a growing positive histogram are three different observations. For a bounded oscillator, entering an extreme zone, remaining there, and leaving it are likewise different events.
“Overbought” does not mean “must fall”
An oscillator near the top of its range is often labeled overbought. In a strong trend, it can stay there because repeated gains are exactly what the calculation measures. Shorting every high reading can amount to repeatedly fighting persistence.
The same observation can support opposing hypotheses:
- Continuation: strong momentum confirms that the move is persistent.
- Reversion: an extreme reading identifies a temporarily stretched move.
- State filter: another setup is allowed only when momentum is neither too weak nor too extended.
The strategy must declare which hypothesis it tests and what additional event turns the reading into an action.
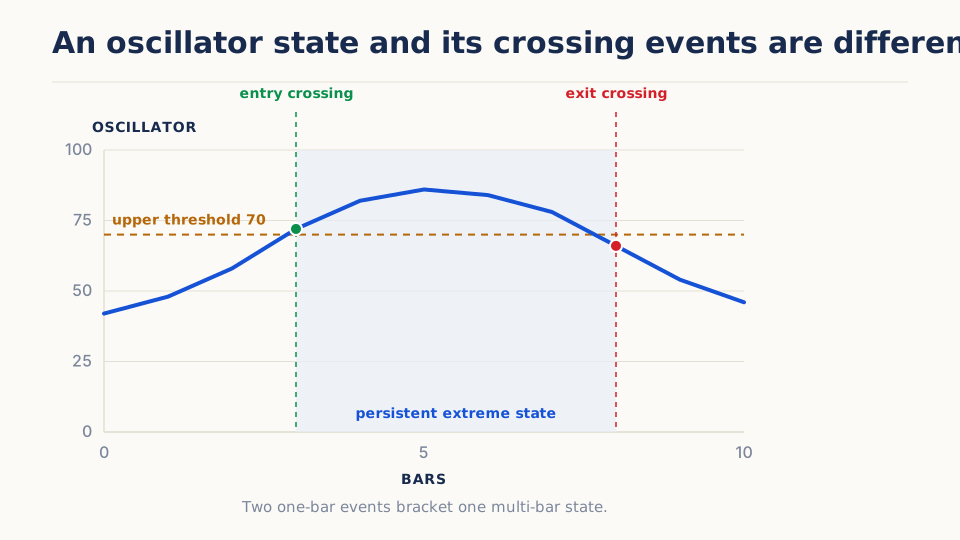
The shaded interval is a state; its two edges are events. A rule that enters on the first crossing, a rule that remains eligible throughout the state, and a rule that waits for the exit crossing will produce different decisions from the same oscillator. This is why “use RSI above 70” is not a complete specification.
A simple RSI interpretation
Arizmic's shipped SMA RSI uses simple rolling averages of gains and losses rather than Wilder's recursive smoothing.
Illustrative example. For a completed 14-bar window:
| Quantity | Calculation | Reading |
|---|---|---|
| Average gain | Given | 0.60 points |
| Average loss | Given | 0.20 points |
| Relative strength | 3.00 | |
| SMA RSI | 75 |
- The level says average gains were three times average losses under this exact window and smoothing convention.
- The transition through 70 identifies one completed-event crossing.
- The duration above 70 describes persistence in that state.
- A later drop below 70 can occur while price remains above its earlier level.
Buying, selling, or exiting on those events are separate strategy choices. The indicator does not select one.
Bounded and unbounded outputs need different comparisons
| Signal form | Example | Interpretation issue |
|---|---|---|
| Percentage change | ROC, cumulative return | Horizon and compounding matter |
| Centered difference | MACD histogram, velocity | Units or scale may vary by asset |
| 0–100 scale | RSI, Stochastic | Thresholds do not imply probabilities |
| Unbounded standardized score | CCI | Distribution and window determine an “extreme” |
| Discrete state | oscillator regime, streak | Thresholding removes magnitude information |
Cross-asset research should normalize outputs appropriately. A five-dollar change is not comparable across price scales; even percentage momentum can have different volatility across markets.
Divergence is an observation, not hidden intent
A divergence occurs when price makes a new extreme and the oscillator does not. This can indicate slowing momentum. It can also arise from window mechanics, smoothing, or one older observation leaving the calculation.
To test divergence:
- define the price and oscillator pivots without future leakage;
- specify the maximum distance between them;
- state when confirmation becomes knowable;
- include all attempted divergences, not only clean chart examples;
- compare with a simpler price-only reversal rule.
How to investigate an oscillator
- Plot raw price change and the oscillator to understand the transformation.
- Separate level, crossing, slope, and duration events.
- Test continuation and reversion hypotheses independently.
- Compare the threshold rule with a continuous or ranked use.
- Inspect turnover and repeated crossings near the boundary.
- Evaluate nearby lookbacks and thresholds on later data.
- Check whether the output adds information beyond a simpler return measure.
False readings to avoid
- Treating an overbought label as a guaranteed reversal.
- Calling multiple price-derived oscillators independent confirmation.
- Using a pivot before later bars confirm it.
- Comparing raw momentum units across instruments.
- Ignoring warm-up and smoothing initialization.
- Optimizing thresholds without accounting for the search.
- Assuming a bounded scale has the same historical distribution in every market and regime.
Shipped signals in this family
Try it in Arizmic
Included with Arizmic
10 prebuilt signals in this family
Use the shipped oscillators to measure rate, relative location, persistence, or gain-loss balance with the normalization made explicit.
- ROC and price momentum measure change; RSI, CCI, and range oscillators normalize different aspects of that change.
- An extreme level, a threshold crossing, and a divergence are different events.
- Continuation and reversal uses should remain separate because the same reading can support either hypothesis.
Ask the AI Companion
Draft a custom oscillator
Create a typed draft whose scale, thresholds, and state transitions are inspectable.
Draft a custom momentum oscillator for [market and bar interval] that measures [rate, range location, gain-loss balance, or acceleration] over [horizon]. Use inputs [list], define the output scale and undefined cases, make lookback, smoothing, and thresholds configurable, and emit separate continuous, state, and crossing outputs only where needed. Compare it with [ROC, RSI, CCI, MACD, or another shipped signal]. Return a typed signal_draft for review only; do not save, run, generate arbitrary Python, or execute anything.
Ask the AI Companion
Explore oscillator uses
Generate distinct continuation, pullback, and transition ideas without turning an extreme reading into a default reversal rule.
For [shipped oscillator] on [market and horizon], explain the scale and each output in plain language. Suggest one continuation use, one pullback or reversal use, and one regime-filter use. For each, specify whether the decision uses level, slope, crossing, or divergence; name a comparison signal; and list the false interpretation most likely to invalidate the idea. Do not execute anything.
Personal notebook
Extend it in Marimo
Open typed Prepared Data in a personal Marimo notebook with the chosen oscillator outputs.
Separate oscillator level, transition, dwell time, and price context.
- Bring in
- completed-bar price, oscillator outputs, threshold-crossing flags, declared thresholds, optional trend-filter state
- Build
- oscillator and threshold timeline, state-duration distribution, crossing and divergence event table
How to read it: Look for long periods spent at an extreme and for crossings that arrive after the price move. The visualization should make state and event semantics impossible to confuse.
Value origin: Threshold tables and event labels created in Marimo are notebook-derived unless they came directly from retained engine outputs.
With Companion: Request a reviewed cell draft for the timeline and dwell-time table, inspect its bounded reads and diff, then apply it explicitly.
Further reading
- Wilder, New Concepts in Technical Trading Systems (1978) — Gives the original Relative Strength Index construction and its smoothing method. It is the clearest primary reference for understanding what RSI measures before treating its thresholds as strategy rules.
- Neely, Rapach, Tu, and Zhou, “Forecasting the Equity Risk Premium: The Role of Technical Indicators” (2014) — Evaluates technical indicators alongside macroeconomic predictors in an out-of-sample forecasting setting. It provides modern empirical context without turning any one oscillator reading into a universal trading instruction.
- Sullivan, Timmermann, and White, “Data-Snooping, Technical Trading Rule Performance, and the Bootstrap” (1999) — Reassesses large families of technical rules while accounting for selection across them. It is an important warning that choosing the most attractive oscillator, threshold, and horizon after inspection changes the evidence.