Structure describes context, not a forecast
Market-structure signals turn a sequence of prices or market events into a description of the environment. They can identify a recent swing high, record that price crossed a previously known boundary, compare two related markets, or label the current liquidity and volatility state.
That description can be useful, but it is not automatically predictive. Saying that price made a “higher high” tells you how two observations compare. It does not tell you that the next return must be positive. A regime label is also a model output rather than a hidden fact waiting to be discovered. Change the variables, thresholds, sampling interval, or lookback and the label can change.
The practical reason to use structure is narrower: it can make another research rule conditional. A breakout may behave differently when volatility is expanding. A reversion trade may deserve a smaller size when a related market has stopped moving with it. An order-flow setup may be more credible after a predeclared level is reclaimed than while price is still moving through it.
Four different questions live in this family
The signals grouped here do not measure one universal idea:
- Price-structure signals ask where confirmed pivots and boundaries are.
- Relative-state signals ask whether related series are moving together.
- Liquidity and urgency signals ask what kind of trading environment is present.
- Sequence signals ask whether a declared series of events occurred in the required order.
Keeping those questions separate prevents a common mistake: combining several labels into a persuasive story even though none has demonstrated incremental value.
Confirmation changes when the signal becomes knowable
Illustrative example. Suppose a swing high is defined as a bar whose high exceeds the highs of the two bars on either side. The visual turning point occurs on bar 3, but the rule cannot confirm it until bars 4 and 5 have completed. A chart that draws the pivot on bar 3 is useful for display; a strategy that acts as if it knew the pivot on bar 3 is looking ahead.
This distinction applies to structure breaks as well. A rule must state:
- which earlier level was already known;
- whether a touch, intrabar trade, or completed close counts as a break;
- when the decision may be submitted;
- whether a later retest is required; and
- what invalidates the structure.
Without those details, “break of structure” is a drawing convention rather than a testable event.
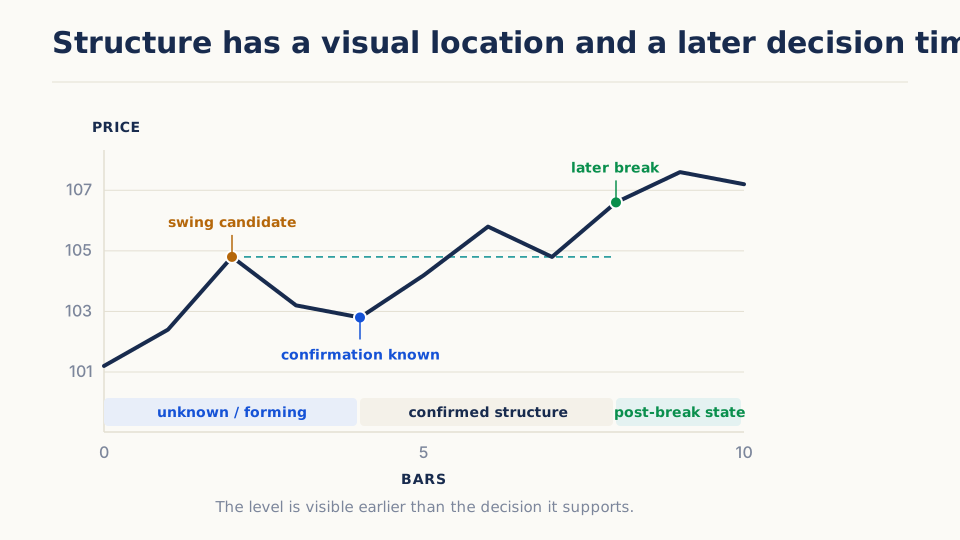
The swing belongs visually to the earlier bar, but the confirmation event belongs to the later decision time. The discrete label beneath the path is a compression of continuous inputs. A credible chart can show both locations without pretending the earlier turning point was known in real time.
Relative structure needs a relationship thesis
A spread, divergence, or cross-market confirmation compares two or more series. For example, a researcher might compare an equity index future with a related sector basket, or a futures contract with a calendar neighbor. The comparison can reveal disagreement, but disagreement alone does not imply convergence.
Before using a relative signal, state why the markets should remain related, which transformation makes them comparable, and what evidence would indicate that the relationship has changed. A fixed price difference, a return difference, a hedge-ratio spread, and a standardized residual answer different questions.
The shipped Relative Close Spread is only primary close minus a backward-as-of-aligned benchmark close. Relative Divergence adds a rolling spread mean, standard deviation, z-score, close-level correlation, and close-level beta estimated without the current observation. It is not a cointegration test, its beta is not automatically a hedge ratio, and it does not size or trade a second leg.
How the shipped signals differ
| Signal group | What it measures | Typical research role | Material caveat |
|---|---|---|---|
| Pivots and structure breaks | Confirmed local highs, lows, and crossings of known boundaries | Trend, reversal, or stop-placement context | Confirmation delay can be hidden by plotting the event backward |
| Relative spread and divergence | Disagreement between related instruments or derived series | Confirmation or relative-value context | The economic relationship can weaken or break |
| Liquidity and urgency regimes | Changes in activity, volatility, or event timing | Eligibility, sizing, or execution context | Labels depend on sampling and threshold choices |
| Zone-touch sequences | Ordered interactions with a region declared before the events | Setup progression and invalidation | A zone selected after the touches embeds hindsight |
Bar Duration Urgency is meaningful only when bar duration is allowed to vary, such as activity- or event-defined bars. Fixed-time bars cannot become urgent by completing sooner. Liquidity/Volume Regime primarily classifies relative volume and volume z-score unless explicit spread or depth inputs are supplied; high volume should not be relabeled as deep liquidity.
Zone Touch Sequencing is downstream of an explicit zone producer. The zone ID, source, price interval, activation time, and expiry are part of the input contract. Touch counts say how often the declared interaction occurred; they do not universally mean that a zone is strengthening or being depleted.
A disciplined way to test context
Begin with a complete baseline strategy that does not use the context signal. Then add one role at a time:
- Gate: permit trades only in the selected state.
- Sizing input: vary exposure while keeping entry logic fixed.
- Exit or invalidation: change how an open position is managed.
Compare the conditional version with the same dates, assets, costs, execution assumptions, and risk budget. Report how often the condition is active, not only the performance while active. A rare state can appear impressive while contributing little usable evidence.
Also test nearby definitions. If a conclusion exists only for one pivot width, one regime threshold, or one zone tolerance, the label may be fitting noise rather than identifying durable context.
False interpretations to avoid
- A pivot displayed at an earlier timestamp was not necessarily actionable then.
- A regime that is defined with realized future returns merely redescribes the outcome.
- A correlation breakdown does not prove either market is mispriced.
- A structure break is not inherently bullish or bearish without a direction, horizon, and exit rule.
- More labels do not create more independent evidence when they are derived from the same prices.
Shipped signals in this family
Try it in Arizmic
Included with Arizmic
7 prebuilt signals in this family
Use the shipped family to expose confirmed pivots, structural sequences, relative relationships, activity state, or zone interactions with their delays and dependencies visible.
- A continuous measurement, confirmed structural event, and categorical regime discard different amounts of information.
- Pivots become available only after right-side confirmation; relative series require explicit alignment.
- Labels such as liquidity, regime, or trapped are transparent rules—not direct observation of an underlying market state.
Ask the AI Companion
Draft a custom structure or regime signal
Create a typed draft that exposes continuous inputs, confirmation delay, thresholds, state memory, and upstream dependencies.
Draft a custom market-structure or regime signal for [market and horizon] that measures [confirmed pivots, break/retest sequence, relative relationship, activity state, or zone interaction]. Use declared inputs [list], specify secondary-series alignment or upstream zone/pivot requirements, and emit continuous evidence separately from confirmation events and labels. Define thresholds, hysteresis, validity windows, warmup, and the first decision time. Compare it with [nearest shipped signal]. Return a typed signal_draft for review only; do not backdate confirmations, infer missing sources, save, run, generate arbitrary Python, or execute anything.
Ask the AI Companion
Explore structure and regime uses
Use shipped outputs as filters, sequence events, or analysis partitions while retaining the continuous evidence underneath.
Explain [shipped structure or regime signal], including every upstream dependency, output, threshold, state transition, and confirmation delay. Suggest one use as a filter, one as a sequence event, and one as an analysis partition where supported. Identify the continuous fields to inspect beside the label and the most likely lookahead, alignment, or causal overstatement. Do not execute anything.
Personal notebook
Extend it in Marimo
Open typed primary and declared secondary or upstream feature context in a personal Marimo notebook.
Place confirmations and labels over the continuous inputs that created them.
- Bring in
- completed-bar primary series, available secondary or upstream fields, continuous signal values, event flags and labels
- Build
- state timeline over continuous inputs, original-candidate versus confirmation-time pivot chart, alignment, dwell-time, and transition audit
How to read it: The notebook should make backdated pivots, stale benchmark alignment, and brittle one-bar states obvious before a label is used downstream.
Value origin: Alternate labels, backfilled swing markers, and custom alignment diagnostics are notebook-derived; preserve original engine decision timestamps.
With Companion: Ask for a reviewed confirmation-and-state audit cell, inspect alignment and timestamp logic in the diff, then apply it explicitly.
Further reading
- Hamilton, “A New Approach to the Economic Analysis of Nonstationary Time Series and the Business Cycle” (1989) — Introduces a probabilistic regime-switching model in which an unobserved state changes the behavior of an observed time series. It provides a formal reference for regime inference while reminding readers that a state label is model-dependent.
- Engle, “Dynamic Conditional Correlation” (2002) — Develops a model for correlations that evolve through time. It supports relative-state features while showing that a fixed correlation threshold is only one possible representation.
- Cont, Kukanov, and Stoikov, “The Price Impact of Order Book Events” (2014) — Shows how order-flow imbalance and depth relate to short-horizon price changes. It gives market-state signals a concrete liquidity mechanism rather than treating every detected change as a new statistical regime.