Order-flow signals describe transactions and liquidity at a finer scale
Order flow is the sequence of trading interest interacting with available liquidity. Footprint-style signals organize executed volume by side, price, and time so a researcher can compare aggressive activity with the price response.
These signals operate below ordinary OHLCV summaries. A bar can show that price rose on high volume. A footprint may show where volume traded, whether it was classified at bid or offer, and whether strong flow moved price or was absorbed near a level.
The added detail does not reveal participant identity or intent. Terms such as absorption, exhaustion, trapped traders, and stop run are interpretations defined by observable event patterns. Each needs a precise calculation and data contract.
From event records to a footprint
A footprint commonly needs:
- ordered trade events;
- price and size for each trade;
- aggressor-side classification or a method to infer it;
- tick-size and instrument metadata;
- a bar or session rule for grouping events;
- enough venue coverage to support the claim.
Volume-at-price aggregates transactions at each price. Bid/ask imbalance compares classified activity across sides or adjacent levels. Stacked imbalance requires the condition to persist across several price levels.
A rendered footprint is therefore a derived dataset, not a direct photograph of all buying and selling interest.
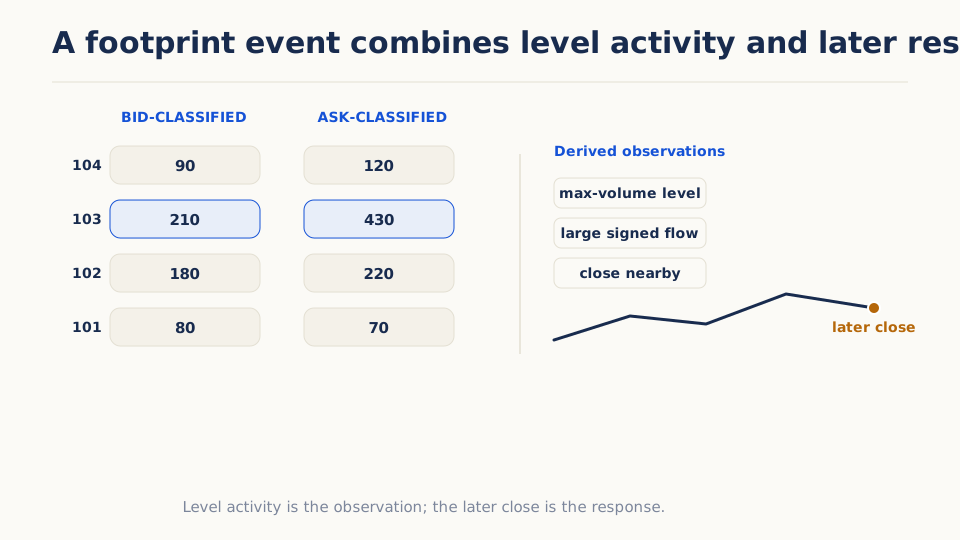
The diagram separates three things that a colorful footprint can visually collapse: volume classified on each side, the price level where activity concentrated, and the bar's later price response. A signal may use all three, but each remains an observed or derived field rather than a statement about who traded.
Trades, quotes, and depth support different claims
| Data view | What it can show | What remains missing |
|---|---|---|
| Trades | Executed price, size, and sequence | Unexecuted liquidity and queue |
| Quotes | Best displayed bid and offer through time | Deeper levels and hidden size |
| Depth | Displayed size across several levels | Hidden liquidity and exact future fills |
| Fixed footprint fields | Pre-aggregated bid/ask volume at declared levels | The complete variable-depth profile |
Arizmic's shipped Footprint Imbalance and Stacked Imbalance signals consume a fixed three-level footprint contract. They can describe those supplied levels; they should not be presented as reducers over an unlimited price ladder. Absorption at Level uses the maximum-volume footprint level as its stable level identity. Those implementation boundaries are part of the meaning, not minor engineering details.
What the common labels are trying to measure
Absorption
Absorption describes strong aggressive flow that produces relatively little price progress near a level. The hypothesis is that resting or replenishing liquidity is meeting the demand. The signal must define “strong,” “little progress,” the price region, and the observation window.
Exhaustion
Exhaustion describes diminishing aggressive participation or progress near the end of a move. Falling delta alone is not enough; it may simply reflect lower overall activity or a window change.
Sweep and reclaim
A sweep/reclaim pattern describes price trading through a reference and then returning across it within a declared time. A chart label does not prove stops were triggered. The observable facts are the level, excursion, event sequence, volume, and reclaim.
The shipped Sweep and Reclaim signal is deliberately narrower: it uses a completed OHLC bar, prior high or low, a minimum excursion, and the closing reclaim. It does not reconstruct which side of the level traded first inside the bar. A tick-aware sequence would be a different signal contract.
Trapped traders
“Trapped” is an inferred position story. A measurable version identifies aggressive entry near an extreme followed by adverse movement and failed continuation. It cannot know which participants remained in the trade.
Finished and unfinished auction
These labels describe whether the extreme shows the volume pattern required by the implementation. They are auction-language summaries, not proof that the market has completed a move.
The shipped version inspects bid and ask volume at the bar's highest and lowest footprint levels against an opposite-side-volume threshold. It does not infer the intrabar path and does not guarantee that an “unfinished” extreme will be revisited.
A simple absorption example
Illustrative example. Fix the tick size at $0.25, the candidate level at $101.00, and the observation window at 30 seconds. For the same instrument and time-of-day bucket, the prior 60 windows have median offer-classified volume of 1,200 contracts.
| When it becomes known | Observed field | Reading |
|---|---|---|
| End of the event window | Offer-classified volume | 3,600 contracts, or 3.0× the declared baseline |
| End of the event window | Bid-classified volume | 900 contracts |
| End of the event window | Delta | +2,700 contracts |
| End of the event window | Best upward progress from $101.00 | $101.25, or one tick |
| End of the next window | Subsequent traded price | $100.50, two ticks below the level |
The notable relationship is not large positive delta by itself. It is large offer-classified volume meeting only one tick of upward progress, followed by a move away from the level. That combination is a sell-side absorption candidate under the declared baseline.
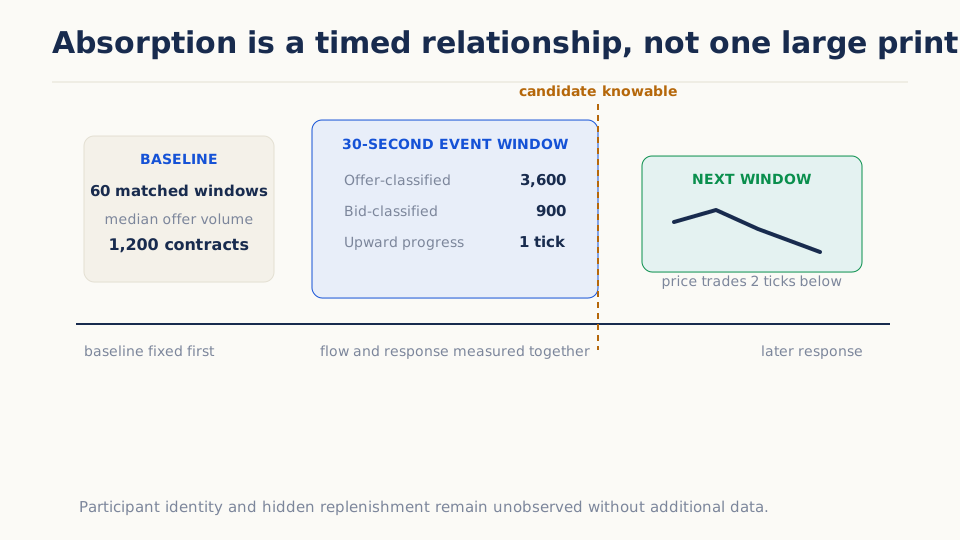
The inference stops there. With trades and footprint fields alone, the researcher has not observed a particular seller, hidden size, or replenishment. Repeated displayed replenishment requires quote or depth updates and its own definition. The candidate is not knowable at the first $101.00 trade: the volume, limited response, and later move become final at different times.
A strategy must therefore state whether it acts after the event window, after the response window, or on another confirmation. Its modeled fill must occur after that decision, not retroactively at $101.00. It must also define invalidation, queue treatment, slippage, and whether the 3.0× baseline remains unusual across instruments and session states.
Closely related signals can double-count the same event
Footprint Imbalance, Stacked Imbalance, Delta Exhaustion, Climax Bar, and Trapped Traders may all respond to the same burst of transactions. Combining them does not necessarily provide five independent confirmations.
Map each signal to:
- raw input events;
- aggregation window;
- normalization baseline;
- threshold;
- output timing;
- overlapping conditions.
Then test whether the additional signal changes decisions beyond the first.
Price-level data changes the execution question
A strategy that reacts to volume at price may need tick replay to reproduce the signal. If it also claims a passive limit fill at the same level, it needs a separate execution model for quote, depth, queue, and latency.
Signal fidelity and fill fidelity are related but not identical. High-resolution evidence for the setup does not automatically validate execution.
How to investigate an order-flow signal
- Define the event and price-level aggregation exactly.
- Plot the raw price response beside the derived label.
- Normalize activity by instrument and time of day.
- Establish when the pattern becomes final.
- Compare with a simpler price-and-volume rule.
- Test other classification and aggregation choices.
- Use event-level execution assumptions consistent with the claim.
- Inspect false positives during news, thin liquidity, and feed gaps.
False readings to avoid
- Treating classified aggressor flow as all buying or selling interest.
- Inferring participant identity from a footprint pattern.
- Calling any large print absorption.
- Labeling a sweep as proof that stops were involved.
- Combining overlapping footprint signals as independent confirmation.
- Using Tick Replay for the signal while keeping a bar-only passive fill claim.
- Ignoring venue coverage, timestamp sequence, and tick-size changes.
- Selecting attractive chart examples without counting every eligible event.
Shipped signals in this family
Try it in Arizmic
Included with Arizmic
10 prebuilt signals in this family
Use the shipped footprint and flow-event signals only when the prepared data supports their level and ordering requirements.
- A three-level footprint summary is not a complete price-by-price profile.
- Bar-close sweep, delta exhaustion, and level absorption encode different evidence and fidelity.
- Pattern names describe transparent conditions; they do not reveal hidden orders or participant intent.
Ask the AI Companion
Draft a custom flow event
Create a typed signal draft whose required data, level identity, event order, and inference boundary are explicit.
Draft a custom order-flow or footprint signal for [market and replay fidelity] that identifies [imbalance, absorption-like response, exhaustion, sweep/reclaim, or auction extreme]. Use only declared inputs [list], state whether they come from bars, volumetric bars, trades, or depth, define level identity and event order, and emit continuous evidence separately from event flags. Make thresholds configurable and list what trader intent cannot be inferred. Compare it with [nearest shipped signal]. Return a typed signal_draft for review only; do not invent unavailable depth, save, run, generate arbitrary Python, or execute anything.
Ask the AI Companion
Explore flow-event uses
Use a shipped pattern as context, confirmation, or an event without promoting its name into a causal claim.
Explain [shipped order-flow signal] using its exact data representation and every output. Suggest one use as context, one as confirmation, and one as an event-study anchor. For each, state the minimum fidelity, a price-only comparator, and what ordering or intent remains unobserved. Flag any mismatch between the signal name and what its implementation can actually establish. Do not execute anything.
Personal notebook
Extend it in Marimo
Open typed replay or footprint-ready Prepared Data in a personal Marimo notebook; if required fields are absent, stop rather than simulate them.
Inspect event anatomy at the level where the shipped signal was actually computed.
- Bring in
- available price-level bid and ask fields, event timestamps, reference levels, completed-bar price path
- Build
- annotated three-level footprint or event chart, flag ingredients and threshold table, event sequence and data-fidelity audit
How to read it: Use the chart to verify what the event can prove. If the notebook needs fields or ordering absent from the retained context, the pattern is not reproducible at that fidelity.
Value origin: Reconstructed levels, inferred sequences, and custom event labels are notebook-derived; never present them as engine-reported footprint evidence.
With Companion: Request a reviewed visualization draft that first checks required columns, inspect the data reads and diff, then apply it explicitly.
Further reading
- Easley, López de Prado, and O’Hara, “Discerning Information from Trade Data” (2016) — Tests methods for inferring aggressor direction and information from trades. It clarifies why footprint classifications depend on the feed and algorithm rather than revealing trader intent directly.
- Cont, Kukanov, and Stoikov, “The Price Impact of Order Book Events” (2014) — Defines order-flow imbalance from trades, limit orders, and cancellations at the best quotes and relates it to short-horizon price changes. It shows what trade-only footprint views omit.
- Farmer et al., “Market Efficiency and the Long Memory of Supply and Demand” (2006) — Examines how adaptive liquidity offsets persistent order flow, providing a mechanism for why apparent pressure, absorption, and subsequent movement need not line up mechanically.
- CME Group, “Market by Order (MBO)” — Describes an official full-depth, order-level feed and the queue information it exposes. It is useful for distinguishing true order-level evidence from footprints reconstructed from trades or top-of-book data.