An auction profile shows where activity accumulated by price
An auction profile reorganizes market activity by price rather than only by time. A volume profile sums traded volume at each price during a declared session or window. The resulting distribution highlights prices where much or little activity occurred.
The profile describes the selected data. It does not reveal a permanent fair value or invisible orders. Its shape changes with session boundaries, tick size, feed coverage, and whether the source is trades, bars, or reconstructed volume-at-price.
The main terms are summaries of that distribution:
- Point of Control (POC): the price with the largest assigned volume.
- Value Area High and Low (VAH/VAL): boundaries around a chosen fraction of profile volume under a declared construction.
- High-volume node (HVN): a region with relatively dense activity.
- Low-volume node (LVN): a region with relatively sparse activity.
Different profile algorithms can produce different value-area boundaries from the same trades. The method belongs in the signal definition.
A small profile example
Illustrative example. Assume a session assigns volume as follows:
| Price | Volume |
|---|---|
| 99 | 100 |
| 100 | 450 |
| 101 | 700 |
| 102 | 500 |
| 103 | 120 |
The POC is 101 because it has the largest volume. Prices 100–102 form a dense region, while 99 and 103 are thinner under this toy profile.
That does not mean 101 is a guaranteed magnet or that 103 is certain resistance. It tells us where activity concentrated in this session. A strategy must test how future price behaves when approaching, crossing, or spending time around those references.
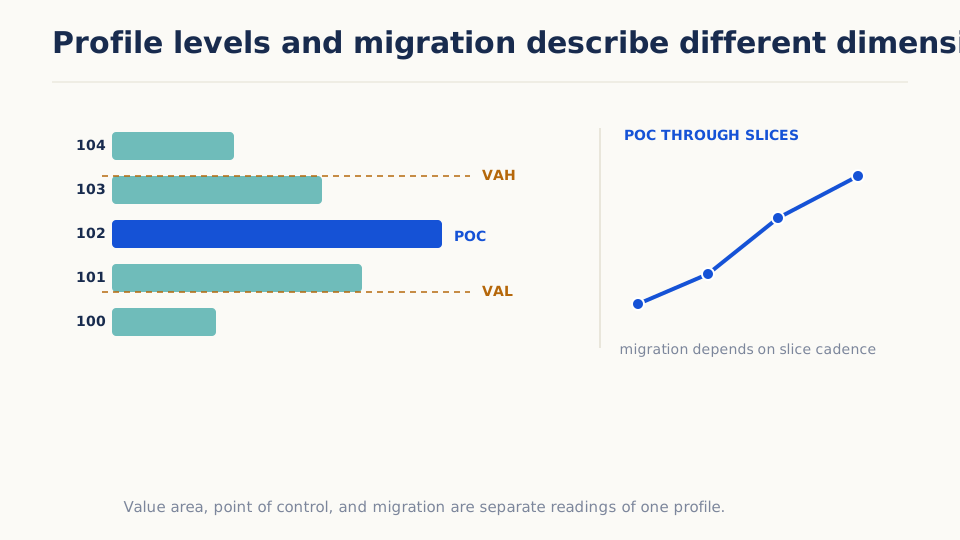
The horizontal bars describe one declared profile slice. POC is the largest node, while VAH and VAL depend on the chosen value-area construction. The later POC marker belongs to another slice. A migration signal compares those references through time; it should not be confused with current price moving through one static profile.
Value, acceptance, and rejection need time
“Acceptance above value” usually means price remains or trades meaningfully above a prior value-area boundary. “Rejection” usually means price moves beyond a boundary and returns.
Both need operational definitions:
- trade, close, or volume beyond the boundary;
- minimum duration or number of events;
- distance tolerance;
- current or prior-session profile;
- event that confirms return or persistence.
A one-tick excursion and a thirty-minute auction beyond VAH should not share a label unless the signal is intentionally that broad.
Migration describes change in the reference
POC migration compares profile centers through time. An upward-moving POC can describe activity concentrating at higher prices. Migration velocity adds the size and time scale of that change.
The signal remains descriptive. A rising POC can accompany continuation, late trend participation, or a temporary distribution shift. The strategy decides whether migration is an entry condition, a position filter, or contextual evidence.
Profile shape can summarize balance
A compact central profile and a split or elongated profile suggest different distributions of activity. Kurtosis, node count, and other shape statistics can summarize these differences.
Shape labels are sensitive to:
- price binning;
- tick size;
- session length;
- total volume;
- smoothing and node threshold;
- missing venues or trades.
Comparing shape across instruments requires consistent normalization and enough activity to make the distribution meaningful.
Arizmic's shipped Profile Shape signal is a transparent classifier using profile kurtosis and the top node's volume share. Its possible labels are concentrated, peaked, balanced, elongated, and unknown under visible thresholds. Those labels are convenient partitions, not canonical auction types.
Confluence does not create independence
Prior-session POC near today’s VWAP, a prior high, or another reference is often called confluence. Two nearby levels can matter operationally because many rules may react in the same region. They are not automatically independent evidence; both may derive from the same price and volume history.
Test the combined rule against each reference separately and report how often confluence occurs. Rare visually attractive cases are especially easy to select after the fact.
Profile data and execution are separate
Building a credible profile may require Tick Replay or volume-at-price data. A strategy entering passively near an LVN also needs a fill model for quote, depth, and queue behavior. Accurate signal reconstruction does not guarantee an executable price.
Several shipped signals intentionally consume profile features rather than building them. Session POC/VAH/VAL exposes upstream scalar levels; HVN/LVN Proximity accepts one supplied node of each type; POC Migration Velocity requires a declared profile-slice cadence. If the retained data contains only those scalars, neither Education nor a notebook should imply that the full horizontal distribution can be reconstructed.
How to investigate a profile signal
- Declare session, data source, price bin, and value-area method.
- Plot the profile and exact numeric outputs.
- Use completed prior-session levels as a clean baseline.
- Define acceptance or rejection with time and distance.
- Compare POC migration with a simpler price trend measure.
- Test continuation and reversion interpretations separately.
- Check sensitivity to binning, session, and feed coverage.
- Match execution fidelity to the order claim.
False readings to avoid
- Treating POC as permanent fair value.
- Assuming HVNs and LVNs mechanically support or repel price.
- Using an undefined percentage or algorithm for value area.
- Calling one print beyond VAH acceptance.
- Selecting an anchor or profile window after seeing the move.
- Combining correlated references as independent confirmation.
- Comparing raw profile shape across different tick sizes and sessions.
- Confusing Tick Replay signal fidelity with validated passive execution.
Shipped signals in this family
Try it in Arizmic
Included with Arizmic
6 prebuilt signals in this family
Use the shipped profile signals to expose supplied POC, value-area, node, shape, migration, and acceptance features without hiding the profile construction.
- A static level, distance to a level, migration, and acceptance sequence are different signal roles.
- Profile scope, price bins, value-area share, and slice cadence determine every output.
- Several shipped signals consume upstream profile features; they do not build the profile themselves.
Ask the AI Companion
Draft a custom profile signal
Create a typed downstream profile signal with explicit upstream dependencies and event semantics.
Draft a custom auction-profile signal for [market and profile scope]. It should consume declared upstream fields [POC, VAH, VAL, nodes, profile moments, or slice timestamps] and measure [proximity, migration, shape, acceptance, or rejection]. State profile construction assumptions, output units, thresholds, hold periods, and decision time; emit continuous location separately from categorical state or events. Compare it with [nearest shipped profile signal]. Return a typed signal_draft for review only; do not claim to build unavailable profiles, save, run, generate arbitrary Python, or execute anything.
Ask the AI Companion
Explore profile-signal uses
Choose a shipped profile output for location, migration, or sequence context without calling every node support or resistance.
Explain [shipped auction-profile signal] from its upstream profile requirements through every output. Suggest one location use, one migration or state use, and one acceptance or rejection use where supported. For each, state profile scope, slice cadence, tolerance or hold rule, and the simpler price-location comparator. Identify what the signal does not build or prove. Do not execute anything.
Personal notebook
Extend it in Marimo
Open typed retained profile features and price context in a personal Marimo notebook; do not imply raw profile data exists if only scalar features were retained.
Show how supplied profile levels, migration, and acceptance state evolve at their actual slice cadence.
- Bring in
- retained profile features, POC, VAH, and VAL, profile slice timestamps, price
- Build
- profile-level and price timeline, POC migration path, acceptance-state sequence table
How to read it: If only POC, VAH, and VAL are retained, visualize those levels rather than fabricating a heatmap. Make slice changes and hold conditions visible.
Value origin: Reconstructed profiles, alternate value areas, and custom acceptance labels are notebook-derived unless retained as engine outputs.
With Companion: Request a reviewed level-and-migration cell draft that first checks retained fields, inspect the diff, then apply it explicitly.
Further reading
- Dalton, Jones, and Dalton, Mind Over Markets: Power Trading with Market Generated Information, updated edition (2013) — Develops the Market Profile vocabulary of value, balance, excess, and auction development used by many practitioners. It is a conceptual practitioner source, not independent evidence that profile rules are profitable.
- TradingView, “Volume Profile Indicators: Basic Concepts” — Documents one widely used implementation’s POC, value-area, row, and volume-allocation conventions. Its details also show why profiles from different platforms or source resolutions may disagree.
- Cont, Kukanov, and Stoikov, “The Price Impact of Order Book Events” (2014) — Relates short-horizon price changes to order-flow imbalance and available depth. It supplies microstructure context for interpreting acceptance or rejection without treating a volume node as a causal force.
- CME Group, “Market by Order (MBO)” — Describes full-depth, individual-order market data. It helps readers distinguish a traded-volume profile from evidence about resting orders, queue position, or cancellations that the profile itself does not contain.