Volatility describes movement; bands place movement around a reference
Volatility signals measure the scale or dispersion of price changes. Band and channel signals combine a central reference with upper and lower boundaries so the current price can be described relative to recent movement or range.
They answer questions such as:
- How large have recent moves been?
- Is current movement unusually quiet or active?
- Where is price relative to a volatility-adjusted envelope?
- Has price exceeded a recent high or low?
They do not determine direction by themselves. Rising volatility can accompany a rally, selloff, or two-sided turbulence. A price touching an upper band can support continuation or reversion depending on the strategy’s hypothesis.
Range and return volatility are not the same
True Range uses the largest span involving the current high, current low, and previous close, so a gap can matter even when the current high-low range is small. Average True Range (ATR) smooths those one-bar values. Arizmic ships both a simple rolling-mean ATR and Wilder ATR; the latter uses Wilder's recursive smoothing and will usually react more slowly after a sudden change. Both remain in price units unless normalized.
Realized volatility summarizes variation in returns. It can be compared across price levels more naturally, but its estimate depends on sampling frequency and scaling. The shipped signal reports rolling log-return dispersion scaled to its window; it does not silently annualize the value.
Exponentially Weighted Moving Average (EWMA) volatility gives more weight to recent squared returns, allowing faster adaptation at the cost of an explicit decay parameter and annualization convention.
Rolling moments and distribution summaries add skew, kurtosis, or other features beyond standard deviation. Arizmic's shipped rolling moments describe close levels, not return moments, so a trend can materially affect them. The rolling distribution signal instead reports empirical median, quartiles, and percentile rank.
Drawdown belongs beside these signals as path context rather than a volatility estimator. It compares current close with the running peak from the start of the selected input. A deep drawdown and high return dispersion can coincide, but they measure different properties.
Bands embed a center and a width rule
A band has at least two components:
- a center, such as a moving average;
- a width, such as a multiple of standard deviation or ATR.
Bollinger-style bands use a moving center and rolling dispersion. Keltner-style channels commonly use a moving center with ATR-based width. Donchian channels use recent highs and lows rather than a dispersion estimate.
Because their widths come from different inputs, a “band touch” is not one common event across these families.
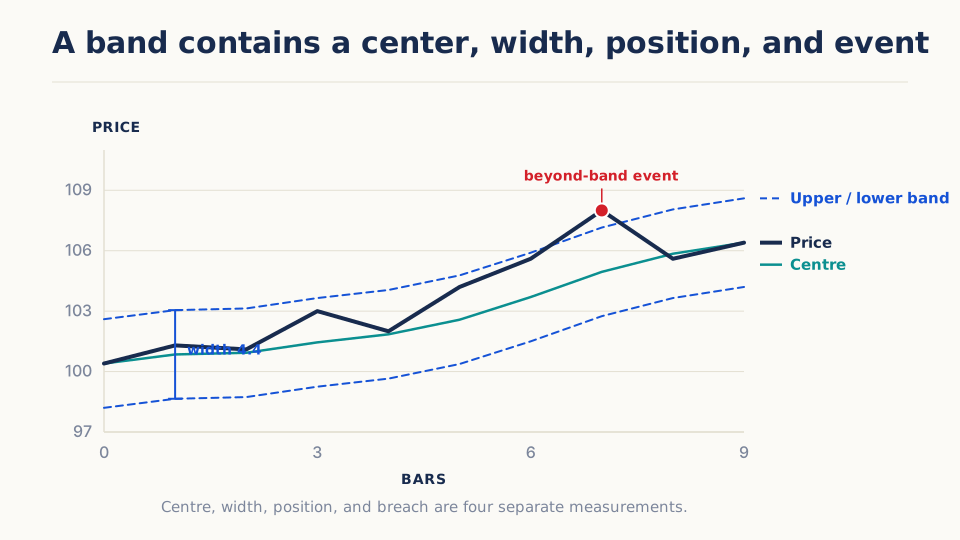
The center, width, normalized position, and boundary event can each become a separate signal output. Keeping them separate prevents a strategy from silently changing when a researcher moves from “price is high inside the band” to “price has just crossed beyond the band.”
A simple band example
Illustrative example. Assume a moving center of 100, a rolling standard deviation of 2, bands at two standard deviations, and a completed close of 104.50:
| Quantity | Calculation | Reading |
|---|---|---|
| Upper band | 104 | |
| Lower band | 96 | |
| Raw distance from center | 4.50 | |
| Standardized distance | 2.25 |
That does not say the market is mispriced or that it must return to 100. During a strong trend, the center and bands can move upward while price remains near the upper boundary. During a temporary shock, the same reading may revert.
Channel position and breakout distance answer different questions
A band-position output describes where price lies between or beyond two boundaries. A breakout-distance output measures how far price is from a prior extreme. A rolling-extreme flag identifies whether a level has been exceeded.
For a Donchian channel, including the current bar’s high when testing whether the current bar broke the high can create a self-reference. A clean breakout usually compares the current decision value with a channel formed from prior eligible observations.
Volatility regimes depend on a reference
Calling volatility “high” requires comparison. High relative to:
- the asset’s past year;
- the same time of day;
- a cross-sectional peer group;
- a long-term distribution;
- a model forecast?
An intraday strategy that compares midday volatility with the full session can confuse ordinary time-of-day seasonality with an unusual regime. A percentile or z-score can normalize the state, but the history and window behind it remain choices.
Band compression is not a direction signal
Narrow bands or low range can identify compression. They do not say which direction a later expansion will take. A strategy may combine compression with a separate range break or trend filter.
To test whether compression adds value, compare the directional trigger alone with the same trigger gated by the compression state. Otherwise the researcher cannot tell whether the band state or the breakout produced the result.
Selecting a signal by the decision it supports
| Decision | Useful measurements | Main caution |
|---|---|---|
| Size a position | ATR, realized or EWMA volatility | Backward-looking estimate can jump |
| Define a dynamic stop | ATR or volatility band | A wider stop changes holding and loss size |
| Detect quiet state | width, range percentile, volatility regime | Time-of-day and lookback matter |
| Test a breakout | Donchian/extreme distance | Exclude current information correctly |
| Test reversion | standardized band position | Extreme does not imply fair value |
| Compare risk | normalized return volatility | Frequency and annualization must align |
False readings to avoid
- Treating high volatility as bearish or low volatility as bullish.
- Calling an upper-band touch automatically overbought.
- Comparing price-unit ATR across instruments without scaling.
- Including the current bar in the prior channel by mistake.
- Interpreting a volatility percentile without its reference window.
- Assuming narrow bands must expand immediately.
- Using the same volatility estimate for signal, size, and stop without recognizing the rules are now coupled.
- Annualizing dependent returns as if variance always scaled linearly.
Shipped signals in this family
Try it in Arizmic
Included with Arizmic
18 prebuilt signals in this family
Use the shipped family to measure movement size, dispersion, envelopes, relative location, range breaks, or categorical volatility state.
- ATR and realized volatility use different units and smoothing; name the convention before comparing them.
- A band level, band width, normalized position, and breakout flag answer different questions.
- Volatility is directionless unless another signal or rule supplies direction.
Ask the AI Companion
Draft a custom volatility signal
Create a reviewable volatility or envelope definition with explicit scale and normalization.
Draft a custom volatility signal for [market and bar interval] that measures [range, return dispersion, compression, expansion, or envelope position]. Use inputs [list], define output units, gap treatment, window, smoothing, annualization if any, warmup, and threshold behavior. If it creates bands, separate center, width, position, and event outputs. Compare it with [ATR, Wilder ATR, realized volatility, Bollinger, Keltner, or Donchian]. Return a typed signal_draft for review only; do not save, run, generate arbitrary Python, or execute anything.
Ask the AI Companion
Explore volatility-signal uses
Map shipped outputs to sizing, eligibility, compression, expansion, or location roles.
Explain [shipped volatility or band signal] for [market and horizon], including its units and every output. Suggest separate uses for risk scaling, compression or expansion state, and price location where applicable. State which ideas require a directional signal, name the closest shipped comparator, and flag smoothing or annualization mismatches. Do not treat a band touch as an automatic trade and do not execute anything.
Personal notebook
Extend it in Marimo
Open typed bar data and selected volatility outputs in a personal Marimo notebook.
Make scale, smoothing, band width, and price location visible on the same timeline.
- Bring in
- OHLC completed bars, selected raw volatility outputs, band center, width, and position outputs, window and warmup masks
- Build
- price-and-envelope chart with beyond-band events, ATR versus Wilder ATR or realized-volatility comparison, bandwidth and range-state distribution
How to read it: Check whether apparent differences come from units or smoothing before assigning market meaning. A visually wide band can coexist with ordinary normalized position.
Value origin: Any rescaling, annualization, percentile, or event label computed in the notebook is notebook-derived and must be labeled as such.
With Companion: Ask for a reviewed chart-and-comparison cell draft, inspect its source diff and selected columns, then apply it explicitly.
Further reading
- Engle, “Autoregressive Conditional Heteroscedasticity” (1982) — Introduces conditional variance dynamics and the idea that current volatility depends on recent information.
- Parkinson, “The Extreme Value Method for Estimating the Variance of the Rate of Return” (1980) — Derives a high–low range estimator of variance, providing the statistical foundation for understanding why range-based volatility can carry different information from close-to-close returns.
- Andersen, Bollerslev, Diebold, and Labys, “Modeling and Forecasting Realized Volatility” (2003) — Uses intraday returns to construct and model realized volatility. It connects chart-level volatility measures with the richer sampling choices available when intraday data exist.
- Bollinger, Bollinger on Bollinger Bands (2001) — Documents the design and intended interpretation of Bollinger Bands, including bandwidth and relative position. It is a practitioner source for the indicator, not independent evidence of trading profitability.