Volume measures activity; delta estimates which side demanded immediacy
Volume is the amount traded during a declared interval or at a price. It says how much activity occurred, not why it occurred and not whether buyers or sellers were “in control.”
Delta tries to separate buyer-initiated from seller-initiated volume. A trade executed against the displayed offer is commonly classified as buyer initiated; a trade against the bid is seller initiated. Bar delta subtracts the estimated seller-initiated amount from the buyer-initiated amount.
The word estimated matters. Some feeds provide aggressor classifications. Others require an inference from trades and quotes. Timestamp mismatch, hidden liquidity, midpoint trades, locked markets, and venue differences can make the classification uncertain.
High volume needs a reference
One million contracts can be extraordinary in one market and ordinary in another. Even within one market, volume is usually high near the open and close and lower at midday.
Common comparisons include:
- rolling average volume;
- volume relative to the same time of day;
- volume z-score under a chosen history;
- percentile within a session or regime;
- volume at a price relative to neighboring prices.
“High volume” without the reference window, session, and instrument is not a reproducible signal.
Delta, cumulative delta, and imbalance are related but distinct
Bar delta
Bar delta summarizes signed volume inside one bar. A positive value means more volume was classified as buyer initiated than seller initiated during that bar. It does not mean price must rise; limit sellers may absorb the demand.
Cumulative volume delta
Cumulative Volume Delta (CVD) adds delta through a declared history. The shipped CVD signal accumulates from the first input row; Session CVD resets only when an explicit session ID changes. Their absolute levels are therefore anchor-dependent and should not be compared across differently started inputs.
On-Balance Volume (OBV) is not another form of delta. It adds all volume on an up-close bar and subtracts all volume on a down-close bar. OBV can be built from ordinary OHLCV bars, but its direction comes from the bar close rather than trade-side classification.
Volume imbalance
An imbalance compares sides or price levels under a declared method. It may refer to bid-versus-ask traded volume, adjacent footprint levels, or a rolling signed-volume ratio. The implementation must be read before interpreting the label.
Divergence
A delta divergence compares price direction with delta or CVD direction. Price rising while CVD falls can suggest that price is moving without matching classified aggressive buying. It can also reflect feed coverage, different windows, or liquidity adjusting to persistent flow.
A simple bar example
Illustrative example. Assume a completed bar contains:
| Classified activity | Units |
|---|---|
| Traded at the offer | 800 |
| Traded at the bid | 500 |
| Delta, offer minus bid | +300 |
Three very different price outcomes are possible:
- Price rises because aggressive buying consumes offers faster than liquidity replenishes.
- Price remains near the same level because new sell liquidity absorbs the buying.
- Price falls afterward because the positive flow was exhausted or informed sellers used it to exit.
The +300 reading describes classified transactions. Interpretation requires price response, context, timing, and a strategy rule.
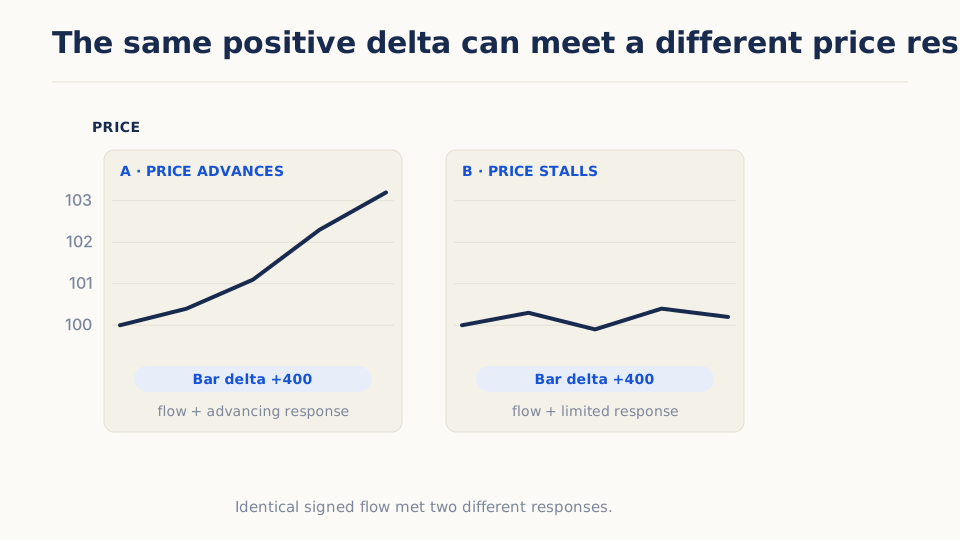
The two panels contain the same signed-flow total. In one, price advances; in the other, it stalls. Delta alone cannot distinguish whether visible liquidity was consumed, replenished, or simply measured incompletely. The useful object is the pair—flow and response—not an isolated green or red number.
Price response gives flow meaning
The same signed flow has different implications depending on how price reacts:
| Flow | Price response | Possible description | What remains unknown |
|---|---|---|---|
| Strong positive delta | Price advances | Demand consumes liquidity | Persistence after the interval |
| Strong positive delta | Price stalls | Possible sell-side absorption | Whether liquidity remains |
| Weak delta | Price advances | Thin offer or hidden mechanism | Data coverage and continuation |
| Negative delta | Price holds | Possible buy-side absorption | Whether support will fail |
These are hypotheses, not direct observations of participant intent. The researcher can observe transactions and price response; “smart money accumulating” is a story unless separately evidenced.
A signal is not confirmation until the baseline is tested
Illustrative example. Suppose a breakout strategy requires relative volume above 1.5 and positive delta. To learn whether those conditions help:
- test the price breakout alone;
- add the volume condition with all other rules fixed;
- add delta separately;
- compare the combined rule;
- report rejected and delayed opportunities;
- use the same decision event and costs.
If volume and delta are final only at the bar close, the strategy cannot claim an earlier fill within that bar. A confirmation that arrives late can improve selection while worsening execution.
Data requirements determine credibility
OHLCV bars support total volume and price/volume comparisons. True bar delta requires volumetric bars or trade-level classification. CVD requires an ordered signed-flow series and a reset policy. Footprint imbalances may require volume-at-price or tick replay.
The shipped Relative Volume signal uses a simple rolling average baseline, not a same-time-of-day baseline. That distinction matters intraday: an opening bar can appear unusually active merely because the rolling window includes quieter pre-open or midday observations. Price/Volume Correlation also relates close and volume levels inside its window; a shared trend can create a relationship that is neither causal nor stable.
When only OHLCV exists, approximating delta from candle direction is a different signal and should be labeled as such. It is not a substitute for aggressor-side volume.
False readings to avoid
- Calling total volume buying or selling volume.
- Treating delta as directly observed when it was inferred.
- Comparing raw volume across markets or times of day.
- Assuming positive delta must produce a price increase.
- Treating divergence as proof of hidden participant intent.
- Mixing session CVD with a rolling or unbounded cumulative series.
- Using final bar volume or delta to justify an earlier intrabar entry.
- Ignoring missing trades or a change in feed coverage.
Shipped signals in this family
Try it in Arizmic
Included with Arizmic
10 prebuilt signals in this family
Use the shipped family to distinguish total activity, signed trade classification, cumulative flow, normalization, and price-flow disagreement.
- Volume is unsigned; delta depends on an upstream bid/ask classification policy.
- CVD keeps all prior input while Session CVD resets at explicit session boundaries.
- High activity, directional imbalance, and divergence are separate observations.
Ask the AI Companion
Draft a custom volume or delta signal
Create a typed draft with explicit volume semantics, reset policy, and normalization.
Draft a custom [volume, delta, cumulative-flow, or price-flow] signal for [market and bar interval]. Use available inputs [volume, classified delta, session_id, price], state the upstream classification assumptions, choose reset behavior [none or explicit session], and emit separate raw, normalized, and event outputs. Make windows and thresholds configurable and define warmup and zero-volume behavior. Compare it with [nearest shipped signal]. Return a typed signal_draft for review only; do not invent missing order-flow data, save, run, generate arbitrary Python, or execute anything.
Ask the AI Companion
Explore volume and delta uses
Connect a shipped signal to participation, confirmation, divergence, or regime roles without overstating trader intent.
Explain [shipped volume or delta signal] for [market and horizon], including source requirements, reset behavior, scale, and every output. Suggest one participation use, one confirmation or divergence use, and one regime use where defensible. Add a price-only comparator and identify what cannot be inferred about buyers, sellers, liquidity, or causality. Do not execute anything.
Personal notebook
Extend it in Marimo
Open typed bars plus available volume, delta, and session fields in a personal Marimo notebook.
Compare activity, classified flow, reset behavior, and price response without implying causality.
- Bring in
- price, volume, delta or cumulative delta, session identifiers
- Build
- price, volume, and delta timeline, CVD versus Session CVD reset comparison, price-change versus delta scatter with source notes
How to read it: Look for high flow with little price progress, reset-boundary artifacts, and disagreements between unsigned volume and signed delta.
Value origin: Any reclassified trades, custom resets, correlations, or divergence labels computed in Marimo are notebook-derived.
With Companion: Ask for a reviewed cell draft using only available typed fields, inspect its reset logic and diff, then apply it explicitly.
Further reading
- Lee and Ready, “Inferring Trade Direction from Intraday Data” (1991) — Defines the classification problem behind buyer- and seller-initiated volume and explains why timing between trades and quotes matters.
- Easley, López de Prado, and O’Hara, “Discerning Information from Trade Data” (2016) — Compares tick-rule and bulk-volume methods for inferring trade direction and information from modern market data. It explains why signed volume remains an estimate even when a chart presents one precise delta value.
- Bouchaud et al., “Fluctuations and Response in Financial Markets” (2004) — Relates persistent order signs to a price response that is not simply permanent and proportional. This helps separate volume imbalance from the price reaction a strategy expects.
- Farmer et al., “Market Efficiency and the Long Memory of Supply and Demand” (2006) — Shows how liquidity can adapt to persistent order flow, helping explain why identical delta readings can have different effects when available liquidity changes.