A trend filter describes direction at a chosen horizon
A trend is a tendency for price to keep moving in one direction for long enough to matter to a particular decision. It is not every higher close, and it is not one objective state that all observers must see. The same market can be rising over six months, falling over twenty bars, and moving sideways inside the current session.
A trend filter turns that irregular price path into a simpler directional reference. It may smooth price, compare two horizons, estimate a slope, measure directional strength, or assign a state such as uptrend, downtrend, or range. The simplification makes a path easier to describe consistently; it also discards detail.
That trade-off is the central idea. A responsive filter follows turns quickly but reacts to more short-lived noise. A stable filter ignores more noise but recognizes genuine turns later. There is no universally correct amount of smoothing because the intended holding period and decision frequency determine which delay is acceptable.
A filter is also not a forecast by itself. “Price is above its 50-bar average” describes the relationship between current price and a recent reference. Whether that state should support continuation, block a counter-trend trade, or trigger an exit is a separate strategy decision.
Five different measurements share the trend-filter label
Signals in this family can all help describe trend, but they do not answer the same question. Treating them as interchangeable “trend indicators” hides the information each one actually contributes.
Smoothed price reference
Simple and exponential moving averages, the Hull Moving Average, Kaufman's Adaptive Moving Average, the Arnaud Legoux Moving Average, and the SuperSmoother all produce a quieter version of recent price.
What to read: whether price is above or below the reference, and whether the reference itself is rising or falling.
What not to infer: that the smoothed line is fair value or a prediction of the next price.
Ordering between two horizons
A fast/slow stack compares a short reference with a longer one. When the fast average is above the slow average, recent prices have pulled the short reference above the longer history.
What to read: the persistent ordering and the size of the spread between the two references.
What not to infer: that every bar with a positive spread is a new crossover or a new entry.
Slope or fitted direction
A moving-average slope measures how quickly a smoothed reference is changing. A rolling regression fits a straight line through the selected window and reports its average change per bar.
What to read: the sign of the slope for fitted direction and its magnitude in the units supplied by the signal.
What not to infer: that the fitted line continues into the future, or that raw slopes are comparable across differently priced instruments.
Directional strength and recency
The Directional Movement Index (DMI) compares positive directional movement with negative directional movement through +DI and -DI. The Average Directional Index (ADX) summarizes how pronounced that separation has been without supplying the direction itself. A rising ADX can therefore accompany either an advance or a decline.
Aroon asks a different question: how recently the highest high and lowest low occurred inside the selected window. It measures recency, not the distance price travelled.
What to read: direction from +DI versus -DI, strength from ADX, and high/low recency from Aroon.
What not to infer: that a high ADX is bullish or that a recent high implies a large upward return.
Stateful and model-based references
SuperTrend maintains an active volatility-adjusted band and directional state. A Kalman trend filter estimates a level and velocity under explicit noise assumptions. Arizmic's Trend Regime combines several simpler measurements into a categorical label.
What to read: the state together with the measurements and assumptions that created it.
What not to infer: that a more elaborate model has uncovered a hidden, error-free “true trend.”
Smoothing always exchanges noise for delay
A short moving average reacts quickly but crosses price and other averages often. A long average changes slowly and can remain pointed in the old direction after a reversal. More elaborate filters alter this trade-off; none eliminates it.
Illustrative sequence. Imagine price rising steadily and then reversing abruptly:
| Moment | Price path | Fast filter | Slow filter |
|---|---|---|---|
| Before the turn | A sustained advance | Rises close behind price | Rises more gradually |
| First new decline | Price changes direction | Begins to flatten or turn | Usually continues rising |
| Several observations later | The decline persists | Clearly points down | Finally flattens or turns |
The slow output is not wrong. It answers a longer-horizon question. Trouble begins when a researcher interprets it as a current turning-point detector.
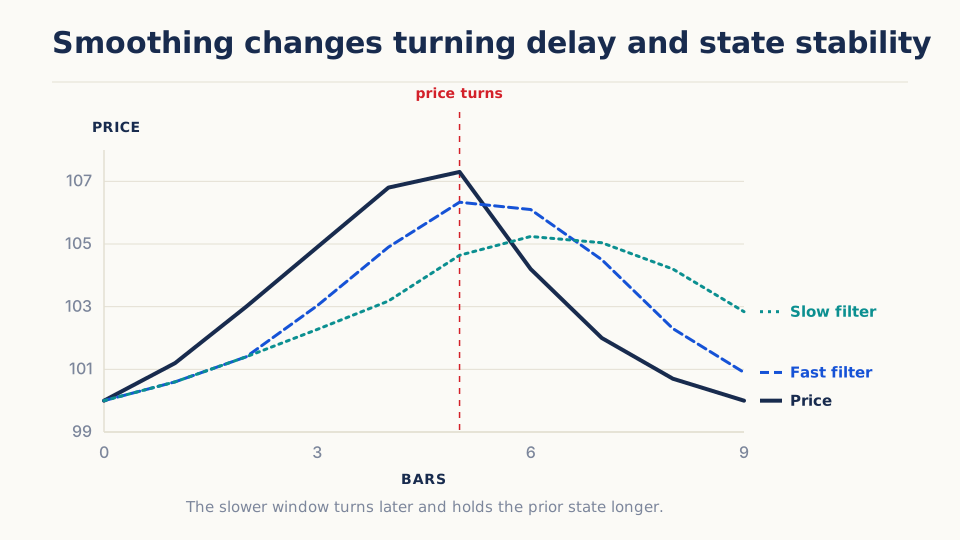
The diagram should be read horizontally. Both filters receive the same price path, but the slow filter retains more of the earlier advance after price turns. That delay can reduce false turns in noisy periods and worsen exits after abrupt reversals. “Less lag” therefore cannot be judged without the extra state changes it permits.
Separate the reading, state, transition, and action
Illustrative example. Suppose a completed bar produces a fast average of 105 and a slow average of 103. The spread is positive by two price units, and it has already been positive for nine bars.
| Layer | What this example contains | What it means |
|---|---|---|
| Signal values | Fast 105, slow 103, spread +2 | The two filtered levels and their current separation |
| Persistent state | Fast remains above slow | Shorter-horizon price remains above the longer reference |
| Transition event | No new cross on this bar | The ordering did not change at this decision time |
| Strategy action | Not specified | Entry, eligibility, sizing, and exit still require explicit rules |
This distinction prevents a common implementation error: treating a state that lasts for many bars as if it were a fresh event on every bar. It also keeps the calculation separate from assumptions about when an order can be submitted or filled.
Compare outputs before selecting a signal
| Filter family | Typical output | Good question | Common misread |
|---|---|---|---|
| Average level | smoothed price | Is price above a recent reference? | The average predicts the next price |
| Fast/slow stack | two levels and spread | Is recent direction stronger than long direction? | Every positive bar is a new entry |
| Cross event | up/down flag | Did ordering change at this completed event? | The fill occurred at the crossing price |
| Slope/regression | slope or fitted direction | Is the reference rising and by how much? | Raw slopes compare across instruments |
| Strength/recency | ADX, DMI, Aroon | Is movement directional or recently extreme? | High strength always means bullish |
| Adaptive/model filter | state estimate and diagnostics | Should smoothing react differently to noise? | Extra parameters remove uncertainty |
A signal reading becomes a strategy only after role is declared
The same positive trend filter can be used in several ways:
- Entry trigger: move from flat to long when the state changes.
- Eligibility filter: allow a separate breakout only during positive trend.
- Exit: close a long position after the state turns negative.
- Position scale: vary exposure with strength.
- Regime label: compare how another strategy behaves in rising and falling states without trading the filter directly.
Changing the role changes the strategy. A filter that improves a mean-reversion rule by preventing trades against a strong trend has not demonstrated that the filter itself is a profitable trend strategy.
Window choice is part of the hypothesis
A 10-bar filter and a 200-bar filter describe different horizons. Testing many lookbacks and reporting the winner creates a selection problem. A stronger experiment declares a plausible neighborhood, compares turnover and lag, and asks whether the conclusion survives nearby choices and later data.
Warm-up also matters. An output should not be treated as valid before the filter has enough observations or its initialization has stabilized. Missing bars and session resets can change the effective window.
How to investigate a trend filter
- Start with one transparent filter and one horizon.
- Plot price, the filter, and the exact completed decision events.
- Measure how often the state changes and how long it persists.
- Compare the underlying strategy with and without the filter.
- Inspect performance in trends, ranges, gaps, and abrupt reversals.
- Apply the same timing and cost model to every alternative.
- Examine a parameter neighborhood rather than one best lookback.
False readings to avoid
- A smooth rising line can be a delayed description of a move that has ended.
- Several moving averages calculated from the same prices are not independent confirmation.
- A high ADX value does not by itself say “up.”
- A completed-bar cross cannot justify a fill earlier inside that bar.
- Raw price slope is scale-dependent across instruments.
- A filter with fewer state changes can look better merely because it trades less and pays fewer modeled costs.
- Adaptive filters add model and initialization assumptions; they do not reveal a hidden true trend.
Shipped signals in this family
Try it in Arizmic
Included with Arizmic
14 prebuilt signals in this family
Use the shipped trend filters as reusable measurements inside a strategy rather than treating a smooth line as a strategy by itself.
- Choose a price reference, a directional-strength measure, or a categorical regime for the role you actually need.
- Distinguish a persistent state such as price above an average from a one-bar event such as a crossover.
- Compare turning delay and whipsaw together; reducing one usually changes the other.
Ask the AI Companion
Draft a custom trend filter
Create a reviewable Signal Program draft with explicit inputs, parameters, outputs, warmup, and timing.
Draft a custom trend-filter signal for [market and bar interval]. I want it to measure [smoothed direction, directional strength, crossover, or regime] over [horizon]. Use catalog-backed inputs [list], emit outputs [continuous values and/or event flags], make every window and threshold configurable, and state warmup and completed-bar timing. Explain how it differs from [nearest shipped signal]. Return a typed signal_draft for review only; do not save it, run a Study, generate arbitrary Python, or execute anything.
Ask the AI Companion
Explore ways to use trend filters
Turn one or more shipped outputs into clearly separated strategy roles and falsifiable ideas.
I am considering [shipped trend signal or signals] for [market, horizon, and strategy idea]. Explain which outputs are levels, strength readings, persistent states, or transition events. Suggest three distinct uses—as an eligibility filter, timing event, exit, or sizing input—and identify one nearby shipped alternative for each. Keep decision time, lag, warmup, and whipsaw visible. Do not combine the ideas into an autonomous strategy or execute anything.
Personal notebook
Extend it in Marimo
Open a personal Marimo notebook from typed Prepared Data so the price series and provenance stay explicit.
See exactly how smoothing choice changes lag, state duration, and disagreement.
- Bring in
- completed-bar close, two selected trend-filter outputs, their windows and warmup masks, optional crossover or regime flags
- Build
- price with both filters and turning points, lag-at-turn table, state-duration and disagreement plots
How to read it: Focus on when filters disagree and whether one merely delays the same state change. A smoother line can look cleaner because it changes less often, not because it identifies direction better.
Value origin: Charts and diagnostics computed in the notebook are notebook-derived; keep them distinct from engine-reported signal outputs.
With Companion: Ask the Companion for a cell draft that reads only the selected typed context, then inspect the preview and diff before explicitly applying it.
Further reading
- Wilder, New Concepts in Technical Trading Systems (1978) — Introduces the Directional Movement system and Average Directional Index, including the smoothing conventions behind signals that later software often labels only as DMI or ADX.
- Brock, Lakonishok, and LeBaron, “Simple Technical Trading Rules and the Stochastic Properties of Stock Returns” (1992) — Tests declared moving-average and trading-range-break rule families, making it useful evidence on both the possible information in simple filters and the importance of evaluating the full rule family.
- Moskowitz, Ooi, and Pedersen, “Time Series Momentum” (2012) — Studies own-return persistence across liquid futures with explicit formation horizons and volatility scaling. It supports trend as a testable cross-asset behavior without implying that every trend filter has the same evidence.
- Kim, Tse, and Wald, “Time Series Momentum and Volatility Scaling” (2016) — Separates the contribution of the momentum signal from volatility scaling, helping readers distinguish a filter’s directional information from the risk transformation applied around it.