A breakout is a move beyond a boundary that already existed
A breakout strategy defines a price range first, then acts when price leaves it. The range might be yesterday’s high and low, the first 30 minutes of a session, the highest and lowest close over 20 days, or a volatility-scaled envelope.
The order matters. If the boundary is chosen after the move, the chart contains a story rather than a test. A valid breakout rule must identify the range using information available before the event that is supposed to break it.
A breakout is related to momentum because both test continuation. The difference is in measurement: a momentum rule usually asks whether past return has a sign or magnitude, while a breakout rule asks whether price crossed a known structural boundary.
Donchian channels are one implementation, not a separate strategy family. Their upper and lower boundaries are rolling extrema. A touch of the current channel, a close beyond the prior channel, and a break followed by a retest are different events with different timing.
Why leaving a range might matter
A range can represent temporary balance: buyers are willing to act near its lower area and sellers near its upper area. New information, one-sided demand, stop orders, or constrained risk transfer can push price beyond that balance. If other participants adjust slowly, the move may continue.
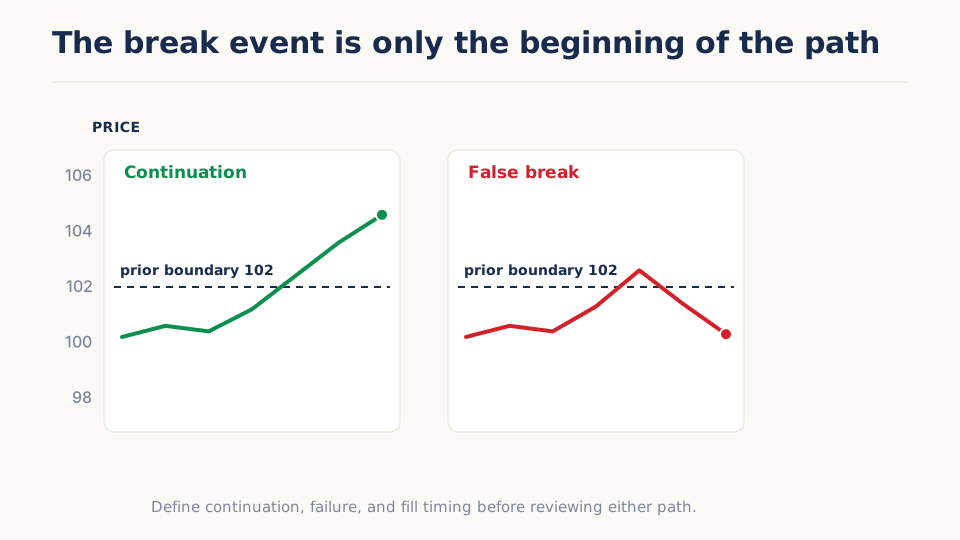
The competing outcome is a false break. Price briefly crosses the boundary, finds no follow-through, and returns into the range. A breakout strategy usually accepts multiple small failed attempts in exchange for participating in fewer extended expansions.
Confirmation changes that trade-off. Waiting for a completed close, a minimum distance, unusual participation, or a successful retest can filter some failures. It also enters later and may miss fast moves entirely.
A declared trading-range-break rule is easier to audit than a discretionary chart boundary. Historical results for one specified construction belong to that construction and sample; they do not prove that any new boundary predicts continuation.
Define the event precisely
| Component | Variants | What changes |
|---|---|---|
| Range | Rolling high/low, session range, prior value, volatility band | The market state treated as balance |
| Price field | Trade high, close, midpoint, or adjusted close | What can cross the boundary |
| Boundary timing | Frozen prior range or continuously updating range | Whether the trigger can be known without circularity |
| Confirmation | Touch, close, distance, volume, persistence, retest | Speed versus evidence of acceptance |
| Entry | Next market event, stop order, or modeled retest | Fill realism and missed opportunities |
| Failure | Return inside, opposite boundary, timeout, volatility stop | What disproves expansion |
| Sizing | Fixed or volatility-aware | Risk when range width changes |
A common error is to use the current bar’s high to define the channel and then declare that the same bar broke that high. The current observation cannot be strictly greater than an extreme that already includes itself. The boundary must usually be shifted to prior completed data.
A 20-day channel example
Illustrative example.
At Monday’s close, the highest completed close over the previous 20 sessions is 100 and the lowest is 90. The rule declares:
- A completed close above 100 creates a long signal.
- A trade occurs no earlier than the next eligible event.
- The position exits on a completed close below the prior 10-day low or after a separate protective risk event.
- The channel recalculates from then-available observations at each decision.
Tuesday closes at 101.20. The signal is known at that close; an illustrative next-open fill of 101.80 is the entry. The backtest may not award a fill at 100 unless it explicitly models a stop order that existed before Tuesday and has data capable of resolving the trigger and slippage.
A retest variant would not enter on Tuesday. It would wait for price to revisit the known 100 boundary and then satisfy a predeclared rejection or renewed-close condition. That design can reduce chasing, but it creates a new sequence rule and different missed-trade behavior.
Design the experiment around a baseline
Start with one prior-range close breakout, a next-event fill, and an opposite-channel exit. Then add one design dimension at a time:
- a small set of range horizons;
- close versus touch confirmation;
- no buffer versus a volatility-scaled buffer;
- direct entry versus retest entry; and
- fixed exposure versus volatility-aware exposure.
The directional trigger alone is the baseline for any added volume or compression gate. Keep execution, sizing, sample, and costs fixed so the incremental contribution of the gate is visible.
Measure more than win rate:
- false-break frequency and distance;
- delay from first contact to entry;
- opportunity count and missed moves;
- turnover and gap slippage;
- distribution of holding periods;
- contribution of the largest expansions; and
- overlap across instruments during common macro moves.
A lower win rate can coexist with a useful positive-skew payoff. Conversely, a high win rate created by tiny targets can conceal occasional large gap losses.
How to interpret robustness
A defensible breakout effect should change coherently as the range becomes shorter or longer. Short ranges normally generate more signals and false breaks; long ranges generate fewer, later entries. A parameter surface that contradicts this intuition should trigger a timing and data review.
Test the rule after costs and with realistic gap handling. If an overnight move opens beyond the boundary, the executable price is the opening opportunity, not the old line on the chart.
Results are less credible when one selected range/confirmation pair works, current-bar boundaries leak information, or the rule is reconstructed around famous historical moves.
Important failure modes
- Balanced markets repeatedly leave and re-enter the range.
- Overnight gaps skip the assumed trigger and increase loss or slippage.
- Stale or missing prices create an artificially narrow range.
- A confirmation filter removes so many trades that its apparent improvement is based on a handful of events.
- Breakouts across markets can express the same crowded macro position.
- A boundary drawn from later pivots or discretionary chart selection embeds hindsight.
Try it in Arizmic
Strategy composition
Build the premise with shipped signals
Build a boundary only from information already available, define whether entry requires a touch, close-through, or retest, and use separate participation and risk signals so a new high or low is not mistaken for a complete strategy.
These are starting structures, not presets or evidence of an edge. Choose one, replace the bracketed decisions, and keep the signal roles separate as you test it.
Composition 01
Donchian break with participation and ATR risk
Close-through recipe- Donchian ChannelPrior range boundary
- Rolling Extreme BreakoutBreak event
- Relative VolumeParticipation confirmation
- Wilder ATRRisk distance
Data: OHLCV Bars
View configuration and complete ruleHide recipe details
Composition 01
Donchian break with participation and ATR risk
Donchian Channel
Prior range boundary
The Donchian Channel provides the rolling upper and lower references against which a completed-bar break is judged.
Configure
- window · [channel lookback]
- Define how much completed history forms the prior range.
Use the output
- upper
- Use the prior available upper channel as the long boundary.
- lower
- Use the prior available lower channel as the short boundary.
- width
- Reject or separately label channels outside [eligible width range].
Rolling Extreme Breakout
Break event
Rolling Extreme Breakout exposes one-bar high and low breakout flags instead of requiring the strategy to infer the event from a persistent state.
Configure
- window · [breakout lookback]
- Match the intended channel history and verify that the implementation excludes the decision bar from its prior boundary.
Use the output
- breakout_high
- Trigger a candidate long when true on the completed bar.
- breakout_low
- Trigger a candidate short when true on the completed bar.
Relative Volume
Participation confirmation
Relative Volume tests whether the break occurred with unusual participation compared with the selected baseline.
Configure
- window · [volume baseline window]
- Set the reference used to define ordinary participation.
Use the output
- relative_volume
- Require at least [participation threshold] or compare gated and ungated variants.
Wilder ATR
Risk distance
ATR scales protection and size to current movement without changing breakout direction.
Configure
- window · [ATR window]
- Estimate movement over a horizon relevant to the holding period.
Use the output
- atr
- Set [ATR multiple] risk distance and derive units from [risk budget].
Assemble the rule
- Entry
- Enter after a completed-bar breakout event beyond the previously known channel and only when the participation policy passes.
- Exit
- Exit on [opposite channel, channel re-entry, ATR protection, or timeout] as declared before testing.
- Decision time
- The boundary must come from prior completed observations; the earliest decision follows the breakout bar.
- Sizing
- Use the ATR risk distance with an explicit unit and gross-exposure cap.
Useful variations
- Compare touch, close-through, and one-bar confirmation while preserving their actual decision times.
- Remove the Relative Volume gate and reconcile the changed trade count and exposure.
- Test nearby channel windows and a channel-width eligibility rule independently.
Keep in view
A rolling channel that includes the current high or low can make the breakout tautological or move the boundary after the event. Verify the signal’s timing contract and retain the prior boundary used at decision time.
Composition 02
Breakout distance with trend-strength eligibility
State-and-distance recipe- Donchian Breakout DistanceBoundary distance
- ADX/DMIDirectional-strength gate
- Volatility RegimeExpansion-state policy
Data: OHLCV Bars
View configuration and complete ruleHide recipe details
Composition 02
Breakout distance with trend-strength eligibility
Donchian Breakout Distance
Boundary distance
Breakout Distance quantifies how far price is from the upper and lower Donchian references, which supports buffers and retest logic.
Configure
- window · [distance lookback]
- Define the channel history used for both directions.
Use the output
- dist_up
- Require dist_up above [positive buffer] for a long candidate.
- dist_down
- Require dist_down below [negative buffer] for a short candidate.
ADX/DMI
Directional-strength gate
ADX/DMI can require that expansion already has measurable directional structure.
Configure
- window · [ADX window]
- Measure strength without simply duplicating the channel horizon.
Use the output
- adx
- Require ADX at or above [minimum strength].
- plus_di
- For long candidates require +DI above -DI.
- minus_di
- For short candidates require -DI above +DI.
Volatility Regime
Expansion-state policy
Volatility Regime distinguishes ordinary breaks from shock states where fills and risk can differ materially.
Configure
- high_z_threshold · [high-volatility threshold]
- Define the shock state.
- low_z_threshold · [low-volatility threshold]
- Define the quiet state used in comparison.
Use the output
- volatility_regime
- Apply [eligible, reduced-size, or blocked] policy by state.
Assemble the rule
- Entry
- Enter when buffered breakout distance, DMI direction, and the declared volatility-state policy agree.
- Exit
- Exit on channel re-entry inside [buffer], DMI reversal, or the chosen risk/timeout rule.
- Decision time
- Read distances and gates only after bar completion and make the next-event decision.
- Sizing
- Use [fixed or separately declared volatility sizing]; the volatility regime label alone is not a magnitude.
Useful variations
- Compare a close-through buffer with a retest of the broken level.
- Treat high volatility as confirmation in one variant and a risk block in another.
- Remove ADX to determine whether it adds information beyond distance and regime.
Keep in view
ADX and volatility filters can select only already mature expansions, improving historical neatness while worsening entry price. Measure delay and missed breaks explicitly.
Ask the AI Companion
Draft this strategy
Turn the breakout premise into a simple draft and explain how the range, confirmation, and exit choices change it.
I want to create a breakout strategy for [instrument] that detects when price leaves an established range and seeks to profit if the move continues. Recommend the type of range, timeframe, and confirmation method you consider the best starting point for this instrument, and then build the strategy for me. Choose whether it should act on a touch, a completed break, or a retest, explain your choice, and include a sensible response when the breakout fails.
Extend it in Marimo
Begin from a retained Study so boundary construction and every entry variant keep their candidate provenance.
Separate true continuation from false breaks without shifting entry markers to the earlier boundary touch.
- Bring in
- engine-reported channel, breakout, participation, ATR, decision, fill, and cost values, prior boundary snapshots and declared entry variant, retained candidates, trades, and no-fill outcomes
- Build
- boundary-and-price chart with touch, close, confirmation, retest, decision, and fill timestamps, event-aligned continuation and failure paths, net outcome, delay, and turnover table by entry variant and volatility state
Interpretation: A confirmed or retest entry may look safer because it acts later. Compare continuation from each variant’s own executable decision time, not from the original touch.
Value origin: Boundaries, signal outputs, decisions, fills, and retained results are engine-reported. Event classifications, matched-variant paths, and custom false-break labels are notebook-derived.
With Companion: Ask Companion to draft timestamp-preserving event-alignment cells, inspect the boundary indexing, then explicitly apply the reviewed diff.
Further reading
- Brock, Lakonishok, and LeBaron, “Simple Technical Trading Rules and the Stochastic Properties of Stock Returns” (1992) — Tests moving-average and trading-range-break rules on the Dow from 1897 through 1986. It is a useful canonical design, but its historical sample and searched rule family do not establish a portable modern breakout edge.
- Sullivan, Timmermann, and White, “Data-Snooping, Technical Trading Rule Performance, and the Bootstrap” (1999) — Re-examines a much larger universe of technical rules with a data-snooping adjustment, showing why a selected breakout rule must be judged against every rule searched.
- Rink, “The Predictive Ability of Technical Trading Rules: An Empirical Analysis of Developed and Emerging Equity Markets” (2023) — Tests 6,406 rules, including 2,040 channel-breakout rules, across 41 equity indices. Apparent predictability declines over time, is sensitive to costs, and generally fails to survive out-of-sample rule selection.