Compression means movement has become unusually quiet
Volatility compression is a state in which recent price movement is small relative to a chosen reference. Expansion is a later increase in movement.
The word relative matters. A daily range of 1% may be quiet for one market and extreme for another. It may also be ordinary at midday and unusual near the open. A compression signal must therefore state both what it measures and what history defines normal.
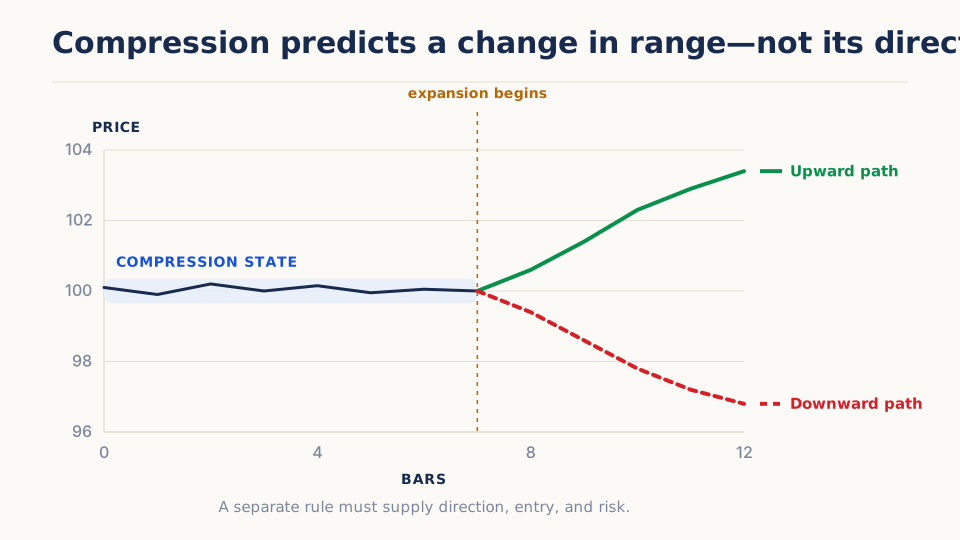
Compression does not predict direction. It can precede an upward break, a downward break, or more quiet trading. A directional strategy usually uses compression as an eligibility condition and a separate price event to choose direction.
This differs from a breakout signal. Compression describes the environment before a potential move; the breakout defines the event that leaves a range. Keeping them separate lets a researcher test whether the quiet-state filter adds value beyond the breakout alone.
Why volatility changes in clusters
Large changes tend to be followed by other large changes, and quiet observations often cluster as well. Information arrival, changing participation, leverage, liquidity, and feedback from risk controls can all contribute to this behavior. Conditional-volatility models formalize this changing variance; they do not imply that a quiet state predicts the direction of the next move.
A quiet period can reflect balanced trading, uncertainty before an event, or positions accumulating without moving the visible price much. A later shock or imbalance can produce expansion. But the same quiet period can persist far longer than expected. “Coiling energy” is a metaphor, not a mechanism that forces release.
The research question is conditional: does a predeclared quiet state change the distribution of a later, separately defined trade?
Different measures describe different kinds of quiet
| Measure | What it summarizes | Important limitation |
|---|---|---|
| Average true range | Recent high-low and gap-aware movement | Price-scale dependent unless normalized |
| Realized volatility | Dispersion of returns over a window | Depends on sampling and can lag sudden change |
| Band width | Distance between volatility or dispersion bands | Inherits the center and scale model |
| Range percentile | Current range relative to historical ranges | Reference window and seasonality define “low” |
| Intraday same-time baseline | Movement relative to the same clock interval | Needs enough comparable sessions |
A global intraday threshold can label the lunch period “compressed” every day simply because activity is normally lower then. A same-time-of-day reference asks the stronger question: is this interval unusually quiet for this interval?
From state to strategy
An illustrative daily rule might be:
- Calculate 10-day realized volatility after each completed daily bar.
- Compare it with the distribution of 10-day volatility over the prior 252 completed sessions.
- Mark the market compressed when the current value is below the 20th percentile.
- While compressed, freeze the previous 10-day high and low as directional boundaries.
- Enter at the next eligible event after a completed close beyond either boundary.
- Exit on a return inside the range, an opposite break, or a declared timeout.
If compression occurs but no boundary breaks, there is no trade. If the market gaps beyond the boundary, the fill must reflect the first modeled opportunity, not the skipped line.
The percentile, lookbacks, and release event are all separate parameters. Changing them together makes it impossible to learn which component mattered.
Design a comparison that isolates the gate
Run the directional breakout without compression first. Then add exactly the same breakout, size, execution, and cost model with the compression gate. Report:
- total and eligible opportunity counts;
- how long compression states persist;
- delay and price distance between compression and release;
- frequency of immediate false releases;
- gross and net return distributions;
- behavior by direction and time of day; and
- sensitivity to neighboring percentiles and lookbacks.
The gate can improve average trade results simply by removing many trades. That is not enough: ask whether the remaining sample is large enough, whether capital sits idle, and whether the improvement survives later periods.
For volatility-scaled positions, freeze or update the risk estimate according to a declared rule. Expansion after entry can shrink the next position, but it cannot retroactively change the exposure already held.
Interpreting the result
A coherent compression measure should identify quieter paths, not merely profitable ones. Check its state against realized ranges before examining strategy P&L.
If the gate is useful, results should not depend on one isolated percentile. The effect should also survive a signal lag and reasonable transaction costs. Expansion magnitude alone is not profit: direction, entry price, exit, and slippage determine whether the move was captured.
Important failure modes
- Quiet conditions persist and tie up attention without producing a trade.
- A scheduled announcement causes a gap that skips the modeled entry.
- Intraday seasonality is mistaken for unusual compression.
- A backward-looking volatility estimate remains low just as the state changes.
- The chosen percentile is fitted to a few famous releases.
- Adding a directional filter, volume filter, and confirmation simultaneously hides which component contributed.
Try it in Arizmic
Strategy composition
Build the premise with shipped signals
Define compression with a measurable range or band-width state, then require a separate directional event when expansion begins. Compression is a setup condition, not a forecast of which way price will break.
These are starting structures, not presets or evidence of an edge. Choose one, replace the bracketed decisions, and keep the signal roles separate as you test it.
Composition 01
Bollinger bandwidth compression with range and volume release
Relative-compression recipe- Bollinger BandsCompression measure
- Range Z-ScoreExpansion event
- Relative VolumeParticipation confirmation
Data: OHLCV Bars
View configuration and complete ruleHide recipe details
Composition 01
Bollinger bandwidth compression with range and volume release
Bollinger Bands
Compression measure
Bollinger Bandwidth reports how narrow the rolling standard-deviation envelope has become relative to price.
Configure
- window · [band window]
- Define the local mean and dispersion history.
- std_multiplier · [band multiplier]
- Set the envelope width while keeping it fixed across compression comparisons.
Use the output
- bandwidth
- Mark compression when bandwidth is below [declared threshold or percentile rule].
Range Z-Score
Expansion event
Range Z-Score identifies a completed bar whose range is unusually large relative to its recent history.
Configure
- window · [range history]
- Define the baseline used to label an expansion bar.
Use the output
- range_zscore
- Require range z-score above [expansion threshold] on the release bar.
Relative Volume
Participation confirmation
Relative Volume checks whether range expansion is accompanied by unusual activity.
Configure
- window · [volume history]
- Define ordinary volume for the selected interval.
Use the output
- relative_volume
- Require at least [participation threshold] or retain it as a comparison label.
Assemble the rule
- Entry
- After a declared compression state, enter in the completed expansion bar’s direction only when range and participation thresholds pass.
- Exit
- Exit on [opposite band state, failure back inside the compression range, volatility stop, or timeout].
- Decision time
- Compression is known before the release; expansion direction is known only after the release bar completes.
- Sizing
- Use [fixed or separately declared volatility-risk sizing] and cap gap-through exposure.
Useful variations
- Define compression by an absolute bandwidth threshold versus a rolling percentile.
- Require both range and volume release versus range release alone.
- Compare immediate release entry with a retest of the former compression boundary.
Keep in view
Band width and bar range are both volatility transforms of price. Their agreement can still be useful as a state transition, but it is not independent confirmation.
Composition 02
Keltner squeeze with regime transition and extreme break
Envelope-transition recipe- Keltner ChannelVolatility envelope
- Volatility RegimeState transition
- Rolling Extreme BreakoutDirectional release
Data: OHLCV Bars
View configuration and complete ruleHide recipe details
Composition 02
Keltner squeeze with regime transition and extreme break
Keltner Channel
Volatility envelope
The Keltner Channel combines an EMA center with ATR-based boundaries, offering a range scale different from standard-deviation bands.
Configure
- ema_window · [center window]
- Set the smoothing horizon for the channel center.
- atr_window · [ATR window]
- Set the range-estimation horizon.
- multiplier · [ATR multiplier]
- Define channel width.
Use the output
- upper
- Use the prior available upper channel as a long release boundary.
- lower
- Use the prior available lower channel as a short release boundary.
- atr
- Retain current channel risk scale for sizing or protection.
Volatility Regime
State transition
Volatility Regime can require a move from a low state into normal or high variability before the boundary break qualifies.
Configure
- high_z_threshold · [high threshold]
- Define unusually high variability.
- low_z_threshold · [low threshold]
- Define compression state.
Use the output
- volatility_regime
- Require [low-to-normal or low-to-high] transition according to the declared recipe.
Rolling Extreme Breakout
Directional release
Rolling Extreme Breakout provides the directional event that volatility state alone cannot supply.
Configure
- window · [breakout window]
- Define the prior extreme used for release direction.
Use the output
- breakout_high
- Trigger the long release candidate.
- breakout_low
- Trigger the short release candidate.
Assemble the rule
- Entry
- Enter only when a prior low-volatility state transitions and a fresh directional breakout is known on the completed bar.
- Exit
- Exit on failed re-entry through the channel, opposite breakout, [ATR rule], or timeout.
- Decision time
- Do not infer release direction during the compression state; act after the breakout bar completes.
- Sizing
- Use the reported ATR under [risk budget] and [gap/exposure cap].
Useful variations
- Compare low-to-normal with low-to-high regime transitions.
- Use Keltner boundary break versus rolling extreme break as the trigger.
- Partition failures by gap, high-volatility overshoot, and immediate channel re-entry.
Keep in view
Volatility-regime labels can change after a large release bar, so the transition may be recognized only after much of the move has occurred. Measure decision delay and gap risk.
Ask the AI Companion
Draft this strategy
Turn a quiet-to-active market idea into a simple draft without implying that quiet conditions predict direction.
I want to create a volatility-compression strategy for [instrument] that finds unusually quiet periods and seeks to profit when price activity expands. Recommend how compression should be measured for this instrument, the timeframe and historical baseline I should start with, and what separate event should determine the trade direction. Then build the strategy for me and explain how it distinguishes a meaningful release from ordinary noise or a gap that is already too late to enter.
Extend it in Marimo
Begin from a retained Study so compression episodes, release events, and threshold neighborhoods remain traceable.
Measure the full sequence from compression through release, continuation, false break, and timeout.
- Bring in
- engine-reported band, range, volume, regime, breakout, decision, fill, and cost values, declared compression and release thresholds, retained candidates and strategy outcomes
- Build
- compression-to-release state timeline, event-aligned paths from the executable release decision, continuation, failure, delay, and turnover table by release definition
Interpretation: A useful release rule should not depend on one unusually quiet threshold or score success from the start of compression. Judge it from the first executable directional decision.
Value origin: Signal outputs, decisions, fills, and retained results are engine-reported. Episode boundaries, matched release labels, and custom continuation summaries are notebook-derived.
With Companion: Ask Companion to draft reviewed episode-analysis cells, inspect state-transition timing, then explicitly apply the diff.
Further reading
- Engle, “Autoregressive Conditional Heteroscedasticity with Estimates of the Variance of United Kingdom Inflation” (1982) — Introduces conditional variance that changes with past shocks. It supplies the foundation for treating volatility as a state, not evidence that a quiet state predicts breakout direction.
- Andersen, Bollerslev, Diebold, and Labys, “Modeling and Forecasting Realized Volatility” (2003) — Connects high-frequency observations to realized-volatility measurement and documents persistent volatility dynamics in exchange rates, clarifying what a compression measure is trying to estimate.
- Corsi, “A Simple Approximate Long-Memory Model of Realized Volatility” (2009) — Models daily, weekly, and monthly volatility components together and shows why the horizon used to define “quiet” matters. Its volatility forecasts do not supply a directional entry signal.