Value asks what the market price buys
A value signal compares an asset’s market price with an accounting or economic quantity such as book equity, earnings, cash flow, sales, or enterprise value. The aim is to distinguish assets priced cheaply relative to a chosen measure from assets priced richly.
“Cheap” is always relative to a definition and a peer group. A low price-to-book bank and a low price-to-book software company do not necessarily represent the same economics. Negative earnings and unusual capital structures can make common ratios meaningless.
A quality signal asks a different question: what do the company’s operations and financing say about the strength or reliability of the business? Common measures include profitability, balance-sheet leverage, accruals, earnings stability, and investment discipline.
Neither score is a verdict. A cheap company may be correctly priced for deterioration. A high-quality company may be so expensive that future returns disappoint. Combining value and quality tries to distinguish inexpensive businesses with stronger characteristics, but the combination is a new strategy that must be tested against each component.
Why value and quality might matter
Value returns may compensate investors for distress, cyclical exposure, or other risks. Behavioral explanations emphasize investor extrapolation: popular companies become too expensive while troubled or boring companies are neglected.
Quality may identify businesses with durable profitability or reduce exposure to fragile firms whose apparent cheapness comes from a collapsing denominator. It may also represent a different set of risks and sector exposures.
These explanations are contested. The practical implication is to report what the portfolio actually owns and when it fails, rather than claiming one ratio reveals intrinsic value.
Point-in-time data is the central contract
Financial statements describe an earlier accounting period but become public later. A company’s December year-end results might be filed in February, revised in April, and restated years later.
A historical strategy may use the figure only after its actual publication time and under the information available then. Replacing it with the latest restated database value gives the past researcher knowledge they did not have.
The same rule applies to index membership, shares outstanding, delistings, and industry classification. Clean modern data is not automatically valid historical data.
Choices that create the portfolio
| Component | Examples | Research consequence |
|---|---|---|
| Value measure | Book-to-market, earnings yield, cash-flow yield, sales yield | Changes sector and accounting sensitivity |
| Quality measure | Gross profitability, ROE, accruals, leverage, stability | Defines “quality” differently |
| Data lag | Filing timestamp plus declared safety lag | Controls lookahead risk |
| Invalid values | Exclude, separate bucket, or alternate measure | Can materially reshape ranks |
| Peer group | Market, country, sector, industry | Controls structural comparability |
| Combination | Screen, independent sort, composite score | Changes interaction between value and quality |
| Rebalance | Monthly, quarterly, annual | Changes freshness and turnover |
Winsorizing extreme observations, standardizing scores, and weighting components are strategy decisions. They should be declared before the outcome is known.
A point-in-time ranking example
Illustrative example. Assume a portfolio rebalances on April 30:
- Freeze the eligible universe using membership and liquidity information known by that date.
- Include each company’s latest filing whose public timestamp precedes the decision cutoff. Do not assume every December fiscal-year report is already available.
- Calculate book-to-market and gross profitability under explicit treatments for negative book equity and missing fields.
- Rank each signal within industry.
- Build three equal-weight portfolios: value only, quality only, and an independent two-way value-and-quality sort.
- Trade at the next modeled opportunity and hold until the next scheduled rebalance.
Illustrative example. Suppose a company files strong results on May 2. Those values belong to the next decision, not the April portfolio. A vendor file that backfills the May result into the December fiscal period would create lookahead unless publication timestamps are enforced.
How to evaluate the combination
Compare value, quality, and combined portfolios with the same universe, availability rules, weights, and costs. Show:
- long and short legs where feasible;
- sector, country, size, beta, and low-volatility exposures;
- score correlations and overlap;
- turnover and cost at each rebalance;
- contribution from distressed and illiquid names;
- performance by decade and economic state; and
- results using alternate defensible definitions.
If the combination improves the backtest because quality removes value’s worst historical failures, test whether the quality screen was selected after those failures were known. A genuine holdout is more informative than a polished in-sample blend.
What the strategy does not tell you
Value is not a short-term timing indicator. An asset can remain cheap for years or fail. Quality is not safety: profitable firms can face valuation compression, regulation, disruption, or leverage hidden by the selected metric.
Factor returns also depend on portfolio construction. A long-only portfolio may look defensive because it underweights speculative stocks, while a long-short spread introduces expensive short exposure.
Important failure modes
- Revised fundamentals or backfilled filing dates leak future information.
- Ratios with negative denominators are ranked as if economically ordinary.
- Sector composition drives the entire result.
- Microcaps supply returns that cannot support the modeled capital.
- The portfolio buys statistically cheap firms undergoing permanent decline.
- A composite is selected from many correlated definitions.
- Rebalancing more often than the accounting signal changes creates cost without new information.
Real-world case
Historical case. Published HML and RMW research factors represent high-book-to-market minus low-book-to-market and robust-profitability minus weak-profitability portfolios. Both are constructed from transparent US equity sorts rather than from a single security.
During the selected January 2021 through December 2022 interval, compounding the published monthly returns turned 1.00 into 1.610 for HML and 1.349 for RMW. That corresponds to cumulative research-factor returns of 60.97% and 34.91%, with maximum drawdowns of 9.90% and 6.01% inside the window. The calculation uses the retained monthly five-factor archive, with data through May 2026.
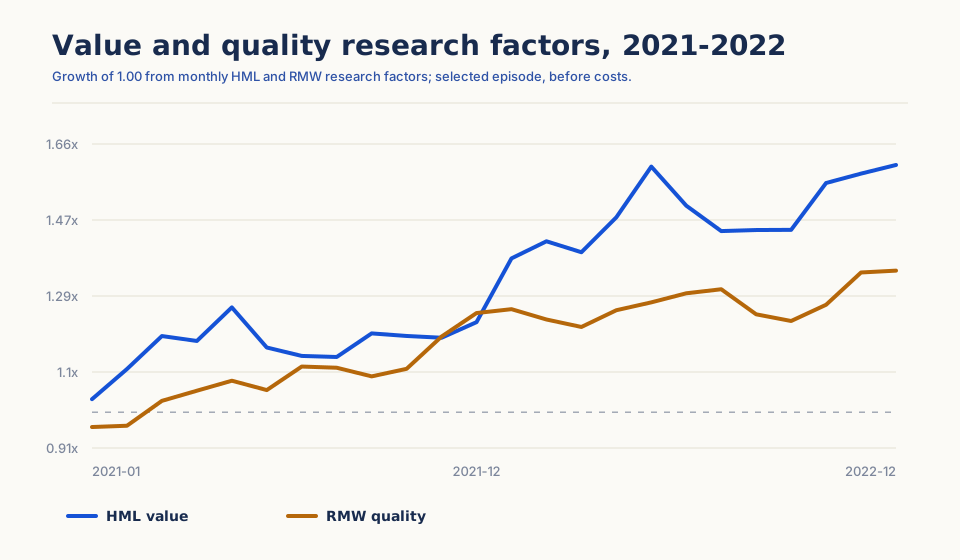
The interval was selected because both concepts are visible, not because it is a typical expectation. It excludes implementation costs and does not recreate a point-in-time investable portfolio. A reader should compare it with the much weaker periods described elsewhere in the guide rather than treating two strong years as proof that either factor must continue.
Further reading
- Kenneth French, Fama/French factor definitions — Defines HML and RMW; the monthly five-factor archive is the retained input for the selected 2021–2022 chart. These are transparent research factors, not investable portfolio returns.
- Fama and French, “Common Risk Factors in the Returns on Stocks and Bonds” (1993) — Defines an influential book-to-market sort and exposes the breakpoints, weights, and long-short construction behind the value label.
- Novy-Marx, “The Other Side of Value: The Gross Profitability Premium” (2013) — Develops gross profitability as a distinct quality characteristic and studies how profitability interacts with value rather than treating “quality” as a single universal score.
- Asness, Frazzini, and Pedersen, “Quality Minus Junk” (2019) — Builds a broader quality composite from profitability, growth, safety, and payout measures across countries. Its exact definitions and neutralizations delimit what the reported factor represents.