VWAP summarizes where volume traded
Volume-weighted average price, or VWAP, is the average transaction price over a chosen window after weighting each observation by its volume. A high-volume price contributes more than a low-volume price.
VWAP is useful because it combines price and participation into one reference. It does not, by itself, estimate fundamental value or promise that price will return. A VWAP-reversion strategy makes an additional hypothesis: after price moves unusually far from the chosen VWAP, the displacement may contract over a declared horizon.
Execution research provides empirical context for VWAP-style benchmarking. That benchmark use does not by itself establish VWAP as a predictive reversion anchor.
The chosen VWAP matters:
- Session VWAP begins again at a declared session boundary.
- Rolling VWAP always uses the latest fixed window and drops older data.
- Anchored VWAP begins at an event selected before the test, such as a session open or announcement timestamp.
The three references can disagree because they remember different trades. A strategy cannot switch among them after seeing which one made a historical turn look clean.
Why price might return—and why it might not
Temporary urgent flow can push price through available liquidity. Once that flow ends and liquidity replenishes, price may trade back toward the volume-weighted center. Dealer inventory adjustment and short-lived imbalances can produce the same pattern.
But volume can also accompany informed repricing. If market participants are building positions in response to new information, VWAP may trail the move rather than attract price. A large distance from VWAP is therefore ambiguous: it can represent temporary dislocation or evidence that the previous trading range is no longer relevant.
The strategy’s real work is distinguishing those states without using future information.
Distance must be made interpretable
A raw $2 displacement means something different for a $20 instrument and a $2,000 instrument. Common normalizations include:
- percentage distance from VWAP;
- distance divided by recent volatility;
- distance divided by volume-weighted dispersion around VWAP; and
- a z-score calculated from a declared historical window.
Normalization improves comparison but introduces more choices. Early in a session, dispersion may be estimated from very little data. During a volatility shock, a backward-looking scale can understate the current environment.
Entry and exit are separate hypotheses
| Component | Variants | Interpretation |
|---|---|---|
| Entry event | First close outside a band, continued extreme, or return inside | Chooses early exposure versus reversal confirmation |
| Context | Time window, trend gate, volume state, or no gate | Tests where the displacement is eligible |
| Target | VWAP, inner band, or fixed price objective | Defines how much closure is required |
| Invalidation | Fixed stop, score threshold, timeout, or structural change | Defines when the anchor has failed |
| Sizing | Fixed or volatility-aware | Controls how changing dispersion affects risk |
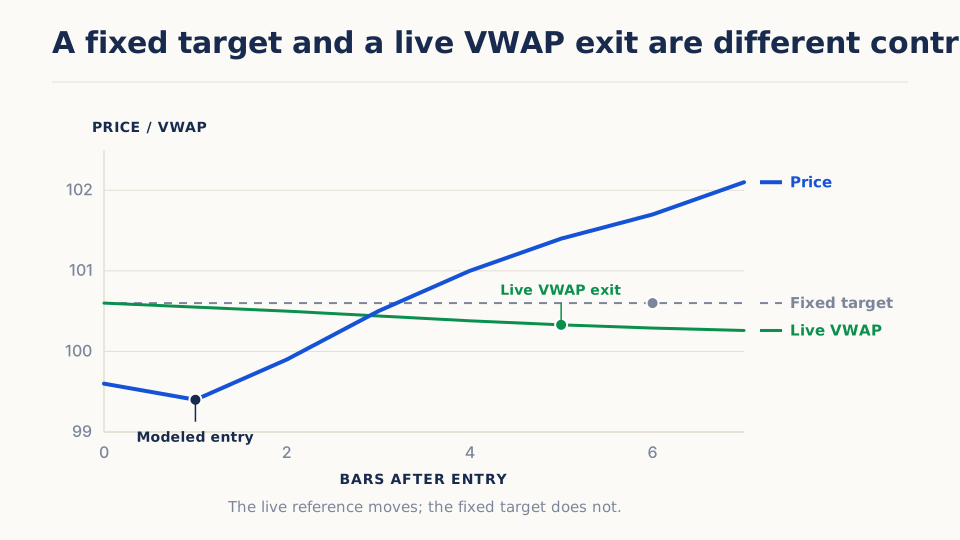
A fixed bracket and a live-signal exit are not the same design. A bracket sets prices from the actual entry and leaves them fixed. A live-signal exit recalculates VWAP and the distance at each decision event. Because VWAP moves, the live exit target moves too.
A complete illustrative trade
Illustrative example.
At 11:00, after the decision bar completes:
- session VWAP is 100.00;
- volume-weighted standard deviation is 1.00;
- the close is 97.80; and
- the normalized distance is −2.20.
An illustrative rule declares:
- Enter long at the next modeled event after a completed score at or below −2.
- Exit when the live score reaches −0.25, after 12 bars, or at −3.5, whichever valid event occurs first.
- Do not add to the position.
- Permit entries only after the first 30 minutes, when the dispersion estimate has met the required warm-up.
Illustrative example. Suppose the fill is 97.90. Over the next bars, price rises to 98.80 while VWAP falls to 99.50. The new score may reach the exit condition even though price never touches the original 100.00 reference. That is correct for a live-signal exit and incorrect for a fixed “return to entry-time VWAP” target.
This distinction should be visible in both the strategy definition and the result explanation.
Designing the study
Use session VWAP as the first baseline because its reset is easy to explain. Test one entry band, one live target, and one timeout. Then compare:
- immediate-extreme entry versus return-inside confirmation;
- percentage versus dispersion normalization;
- live-signal exits versus fixed entry brackets;
- early, middle, and late session windows; and
- no context gate versus one independently defined trend or volatility gate.
Keep the data and execution model aligned with the claim. A bar-close signal can support a next-event market decision; it cannot prove that a passive limit order was first in queue at the threshold.
Report opportunity count, fill assumptions, time to exit, maximum adverse excursion, timeout rate, long/short asymmetry, and net results after the full round trip. Plot the raw price, evolving VWAP, entry-time VWAP, and score together for representative trades.
Interpreting evidence without telling a chart story
A coherent result should show fewer opportunities at wider bands, a sensible relationship between distance and adverse excursion, and understandable changes when the timeout or exit family changes. Performance should not depend on receiving the bar’s extreme before the close that generated the signal.
Separate balanced sessions from opening gaps and persistent trends using predeclared context. If all gains come from one calm time window, the rule is not a general VWAP effect.
Important failure modes
- A news-driven move can leave VWAP behind for the rest of the session.
- Early-session warm-up can make normalized distance unstable.
- Session definitions and time zones change the reference and reset.
- A rolling VWAP can chase price and make an unresolved trade appear closer.
- Short-horizon costs can consume a modest return to the anchor.
- Passive fill assumptions require quote, depth, queue, and latency evidence that ordinary bars cannot provide.
Try it in Arizmic
Strategy composition
Build the premise with shipped signals
Treat VWAP as a declared anchor, measure distance from it in a way that matches the session or event, and keep the exit contract separate from the entry. These recipes contrast a session-relative setup with an anchored-event setup.
These are starting structures, not presets or evidence of an edge. Choose one, replace the bracketed decisions, and keep the signal roles separate as you test it.
Composition 01
Session VWAP z-score with participation and ATR risk
Session-anchor recipe- Session VWAP True Z-ScoreEntry displacement
- Relative VolumeParticipation gate
- Wilder ATRFixed-at-entry risk scale
Data: OHLCV Bars
View configuration and complete ruleHide recipe details
Composition 01
Session VWAP z-score with participation and ATR risk
Session VWAP True Z-Score
Entry displacement
Session VWAP True Z-Score reports both the session anchor and a volume-weighted standardized distance from it.
Configure
No configurable parameter is required for this role.
Use the output
- zscore
- Create a long candidate below [negative threshold] and a short candidate above [positive threshold].
- session_vwap
- Use the live session VWAP only for the exit variant explicitly declared as signal-driven.
- distance
- Retain raw distance for price-unit diagnostics and fixed-at-entry records.
Relative Volume
Participation gate
Relative Volume distinguishes an active displacement from one occurring in unusually thin participation.
Configure
- window · [volume baseline window]
- Define the reference used to judge current participation.
Use the output
- relative_volume
- Require relative volume within [eligible range] or compare gated and ungated variants.
Wilder ATR
Fixed-at-entry risk scale
ATR can freeze a protection distance at entry so it does not move with the live VWAP after the fill.
Configure
- window · [ATR window]
- Estimate current session movement for risk sizing.
Use the output
- atr
- Freeze [ATR multiple] times entry-bar ATR as the initial invalidation distance.
Assemble the rule
- Entry
- After a completed bar crosses the declared VWAP z-score threshold and participation passes its gate, enter on the next eligible event.
- Exit
- Choose before testing: return to live session VWAP, partial z-score reversion, fixed bracket frozen at entry, or timeout.
- Decision time
- Store the decision-bar VWAP, z-score, and ATR; never reconstruct entry from a later VWAP path.
- Sizing
- Derive units from the frozen ATR risk distance and [risk budget].
Useful variations
- Compare a fixed-at-entry bracket with a live VWAP exit without changing entry selection.
- Remove the Relative Volume gate to measure whether it adds information or only selectivity.
- Test nearby z-score thresholds and report event overlap rather than treating every threshold as a new independent trial.
Keep in view
Session VWAP and its dispersion evolve after entry. A live anchor exit is valid only when modeled as a recalculated signal; it must not be described as the fixed bracket known at the fill.
Composition 02
Anchored displacement with extreme block and trend exclusion
Event-anchor recipe- Anchored VWAP DistanceAnchored displacement
- Multi-SD VWAP Extreme/BlockPersistence check
- ADX/DMITrend exclusion
Data: OHLCV Bars
View configuration and complete ruleHide recipe details
Composition 02
Anchored displacement with extreme block and trend exclusion
Anchored VWAP Distance
Anchored displacement
Anchored VWAP Distance measures current price relative to an upstream anchored VWAP and standardizes that distance over a declared history.
Configure
- zscore_window · [distance history]
- Set the history used to standardize distance from the chosen anchor.
Use the output
- zscore
- Create a candidate beyond [positive or negative threshold].
- distance
- Retain the price-unit displacement for execution and risk interpretation.
Multi-SD VWAP Extreme/Block
Persistence check
Multi-SD VWAP Extreme/Block distinguishes a one-bar extreme from an extreme that persists for the declared block window.
Configure
- z_threshold · [extreme threshold]
- Define the standardized distance that qualifies as extreme.
- block_window · [persistence bars]
- Specify how long the extreme must persist before the block output changes.
Use the output
- extreme
- Identify that price is currently beyond the declared extreme.
- block
- Use the block state as [avoid-entry, delayed-entry, or separate variant], not as an automatic reversal.
ADX/DMI
Trend exclusion
ADX/DMI identifies cases where anchored displacement is occurring inside strong directional continuation.
Configure
- window · [ADX window]
- Measure trend pressure at the expected holding horizon.
Use the output
- adx
- Block or reduce entries above [maximum trend strength].
Assemble the rule
- Entry
- Enter only after anchored z-score reaches the threshold, the chosen block policy is satisfied, and ADX remains within the declared reversion regime.
- Exit
- Use [anchored VWAP return, partial z-score reversion, timeout, or fixed risk rule] and state whether the anchor itself can reset.
- Decision time
- The anchor timestamp and every persistence requirement must be known before the completed decision bar.
- Sizing
- Use [fixed risk distance or separately declared volatility input]; anchored distance itself is not a sizing model.
Useful variations
- Treat persistent extremes as a block in one version and a delayed trigger in another.
- Compare session and event anchors over the same eligible episodes.
- Partition outcomes by ADX state and anchor age.
Keep in view
The anchored-distance signal assumes an upstream anchor chosen without future knowledge. A visually compelling anchor selected after the move creates lookahead even if every later calculation is causal.
Ask the AI Companion
Draft this strategy
Turn the VWAP-reversion premise into a simple draft and explain how the chosen VWAP reference affects the trade.
I want to create a VWAP-reversion strategy for [instrument] that detects unusually large moves away from a relevant volume-weighted reference and seeks to profit as price moves back toward it. Recommend whether I should begin with session VWAP or an anchored VWAP, which timeframe to use, and how distance from the reference should be measured. Then build the strategy for me, decide whether its exit should follow the changing VWAP or use a target fixed when the trade begins, and explain why.
Extend it in Marimo
Begin from a retained Study so candidate events and fixed-versus-live exit variants remain attached to their provenance.
Compare fixed-at-entry and recalculated VWAP exit contracts on the same displacement events.
- Bring in
- engine-reported VWAP, z-score, distance, participation, ATR, decisions, and fills, frozen entry-bar values and live post-entry signal values, retained trades, costs, exits, and candidate identifiers
- Build
- annotated price-and-VWAP path with original decision and fill markers, fixed-versus-live exit timeline for each shared entry event, adverse/favorable excursion and time-to-exit table by displacement and participation state
Interpretation: Focus on trades where VWAP moves materially after entry. Those cases reveal whether an exit responds to price reversion, anchor drift, or a contract that changed after the fill.
Value origin: VWAP series, signal outputs, decisions, fills, and retained outcomes are engine-reported. Matched-event comparisons, anchor-drift labels, and custom excursion summaries are notebook-derived.
With Companion: Ask Companion to draft matched-event comparison cells, preview the diff, inspect how fixed and live values are separated, then apply it explicitly.
Further reading
- Berkowitz, Logue, and Noser, “The Total Cost of Transactions on the NYSE” (1988) — Introduces daily VWAP as an execution-cost benchmark and applies it to more than 14,000 NYSE trades; it establishes benchmark use, not predictive attraction toward VWAP.
- Madhavan, “VWAP Strategies” (2002) — Explains when VWAP is a sensible execution benchmark and how measuring traders against it can change behavior, costs, and risk.
- Farmer et al., “Market Efficiency and the Long Memory of Supply and Demand” (2006) — Shows how persistent signed order flow can coexist with efficient prices through adaptive liquidity and variable impact; it supports the temporary-versus-informed-flow distinction, not a generic VWAP-reversion rule.