Price tells you where; return tells you how much changed
A price is quoted in the units of an instrument. A return expresses the change relative to the capital or price at the start of a period. That conversion makes different instruments and periods comparable: a five-point move is enormous for a 20-dollar asset and modest for a 5,000-point index.
The simplest one-period return is the ending value divided by the starting value, minus one. If price moves from 100 to 105, the simple return is 5%. That statement still needs an economic definition. A total-return series may include dividends or distributions; a futures strategy may earn profit and loss (P&L) against posted capital rather than the quoted contract price; a leveraged portfolio’s return depends on the chosen equity base.
For research, the denominator is part of the metric. “The strategy made 10,000” is currency P&L. “The portfolio returned 10%” says the P&L relative to a declared starting or time-varying capital base.
Simple returns and log returns answer different needs
Simple returns map directly to wealth. If a portfolio earns 5%, one unit of wealth becomes 1.05 units. Consecutive simple returns compound by multiplying their wealth relatives.
Log returns take the logarithm of the price ratio. They add across time, which is useful in modeling and attribution, but converting their average directly into a simple wealth change can be misleading. Simple returns add across simultaneous positions when weights and timing are defined; log returns do not generally aggregate across assets that way.
Neither representation is universally superior. Use the representation that matches the question, and label it.
Why +10% and −10% do not cancel
Illustrative example.
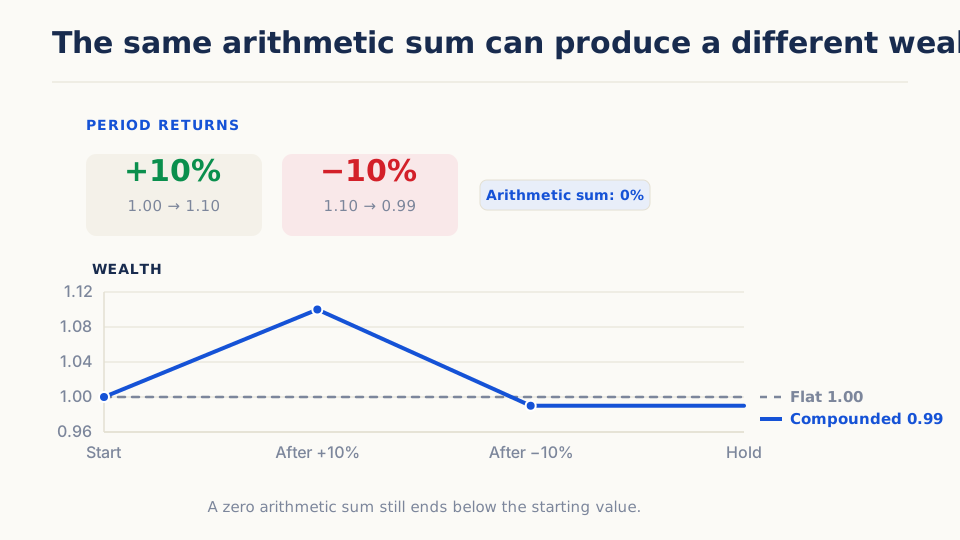
Start with 100. A 10% gain produces 110. A later 10% loss is measured from 110, so it removes 11 and leaves 99. The two-period compounded return is −1%, even though the arithmetic average of the two periodic returns is 0%.
This is volatility drag in its simplest form: percentage gains and losses apply to different capital bases. Recovering from a 20% loss requires a 25% gain; recovering from a 50% loss requires a 100% gain.
| Loss from peak | Wealth remaining | Gain required to recover |
|---|---|---|
| 10% | 90 | 11.1% |
| 20% | 80 | 25% |
| 50% | 50 | 100% |
That asymmetry is why an average periodic return cannot replace an equity curve.
Compounding a return path
For simple periodic returns, ending wealth is obtained by multiplying each period’s wealth relative:
Here, is starting wealth, is the simple return in period , and is ending wealth. The order of returns does not change this final product when there are no cash flows, but it does change drawdown, margin pressure, and whether a real strategy could remain funded.
External deposits and withdrawals require a policy. Time-weighted returns try to remove the effect of external cash-flow timing. Money-weighted returns incorporate it. They answer different performance questions.
Total return and average return are not interchangeable
The same two-period path can be summarized several ways:
| Summary | Value for +10%, then −10% | What it answers |
|---|---|---|
| Arithmetic average | 0.00% per period | What was the average of the two reported period returns? |
| Compounded total return | −1.00% | How much did wealth change across the complete path? |
| Geometric average | About −0.50% per period | What constant periodic return would produce the same ending wealth? |
The geometric average is found by taking the periodic growth rate that turns 100 into 99 over two periods: . It is often the more relevant average for a multi-period wealth path, but it still says nothing about the order of returns, drawdown, or external cash flows.
This distinction prevents a common reporting error: an arithmetic average can describe the observations correctly while overstating the growth actually experienced by capital.
Annualization is a translation, not extra evidence
Annualization expresses a periodic rate on a yearly scale. It does not create more observations or turn a short sample into a year of experience.
For a compounded return measured over a known fraction of a year, a common translation is:
where is the length of the measured period in years. For an average periodic return, multiplying by periods per year is an arithmetic convention, not the same calculation as compounding wealth.
The correct period count depends on the series. Daily market returns may use trading days; a continuously operating crypto strategy may use calendar days; an irregular trade series does not become daily merely because it contains many trades. Mixing conventions can make two otherwise identical results disagree.
Returns before and after costs
Gross return describes the strategy before some or all implementation costs. Net return reflects the costs actually included in the model. The label should identify fees, spread, slippage, financing, borrow, and other relevant charges.
Turnover can leave the gross path nearly unchanged while materially changing the net path. Comparing a net strategy with a gross benchmark is therefore not a fair comparison.
What to inspect in a result
- Is the number currency P&L, a simple return, a log return, or an annualized rate?
- What capital base or denominator was used?
- Are distributions, financing, and external cash flows included?
- Is the result gross or net, and which costs are modeled?
- Does the reported total return reconcile with starting and ending equity?
- Is annualization appropriate for the sample length and observation cadence?
- Does an average return hide an unfavorable compounded path?
Further reading
- Hudson and Gregoriou, “Calculating and Comparing Security Returns Is Harder Than You Think” (2015) — Directly compares simple and logarithmic returns and explains how the chosen return definition interacts with variance and observation frequency.
- CFA Institute, “GIPS Standards Handbook for Firms” — Provides authoritative conventions for geometric linking, external cash flows, time-weighted returns, money-weighted returns, and annualized performance presentation.
- Jacquier, Kane, and Marcus, “Geometric or Arithmetic Mean: A Reconsideration” (2003) — Explains why arithmetic and geometric averages answer different forecasting questions and why blindly compounding either historical estimate can bias a long-horizon projection.