One backtest path is one ordering of events
A historical equity curve shows the sequence that happened under the backtest model. It does not show how sensitive the conclusion is to the order of trades, the particular sample drawn, or a deliberately changed market assumption.
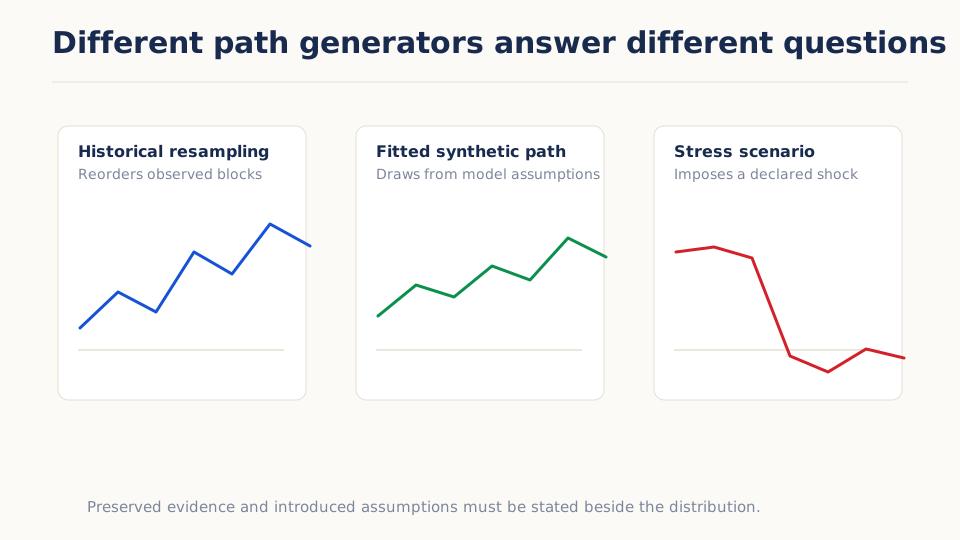
Monte Carlo, resampling, and stress analysis create alternative outcomes, but they do so in different ways:
- Resampling rearranges or redraws observed data.
- Synthetic simulation generates new values from an assumed model.
- Stress analysis imposes a specified adverse change or scenario.
Calling all three “Monte Carlo” hides the most important question: what was allowed to change, and what was held fixed?
Resampling reuses the evidence you already have
A simple bootstrap draws observations from the historical sample with replacement. If the strategy produced 200 trade returns, one bootstrap path draws 200 of those returns, allowing some to appear more than once and others not at all. Repeating this creates a distribution of outcomes under the assumption that the observed trades are representative draws.
That assumption can be too strong. Trading returns often cluster by regime, instrument, or position. Randomizing every observation independently destroys local dependence. A block bootstrap draws consecutive groups. A stationary bootstrap uses random-length blocks so nearby dependence can be retained while the full sequence changes.
Resampling cannot invent a market state absent from the source sample. If the history contains no liquidity crisis, redrawing it does not create one.
The resampling unit is part of the hypothesis
What gets redrawn determines what the alternative paths preserve:
| Resampling unit | What it can preserve | What it usually breaks |
|---|---|---|
| Individual returns | The observed marginal return values | Serial dependence, regimes, and overlapping positions |
| Completed trades | The observed trade outcomes | The price path and strategy decisions that created those trades |
| Consecutive blocks | Local order and dependence within each block | Relationships spanning block boundaries |
| Instruments within a date | That date’s market outcome and cross-section size | The original mapping from signal to instrument |
| Whole historical episodes | A recorded joint market state | Variation inside and beyond the small set of selected episodes |
There is no neutral shuffle. The unit should preserve the structure treated as nuisance and disturb the relationship being investigated.
Trade-order permutation asks a narrower question
A trade-order permutation keeps the observed trade outcomes but changes their order. Final compounded return may remain similar under fixed size, while maximum drawdown, losing streaks, margin pressure, and ruin probability change.
This answers: how dependent is path risk on the favorable or unfavorable order in which the observed outcomes arrived?
It does not test whether the trades themselves would change under a different price path. A strategy whose entries depend on previous losses, volatility, or capital would need the strategy to be rerun, not merely have finished trades reordered.
Synthetic paths depend on a model
A parametric simulation estimates a process—perhaps a distribution, volatility model, or price dynamics—and draws new paths from it. Synthetic paths can produce values not present in the historical sample, which is useful when the model captures a relevant mechanism.
The cost is assumption risk. Normal independent returns produce different tails from skewed, fat-tailed, autocorrelated, or regime-switching returns. A beautiful fan chart can simply be a picture of the chosen model.
Always state:
- which variable is simulated: trades, returns, prices, spreads, or another input;
- the fitted distribution or process;
- how dependence and regimes are represented;
- whether the strategy is rerun on each path;
- which parameters remain fixed;
- how many simulations were drawn and with which seed.
Stress paths begin with an explicit “what if”
A stress is not a random redraw. It changes an assumption deliberately:
- spread and slippage double;
- a price gap skips the modeled stop;
- volatility rises and correlation converges;
- a trend reverses more quickly;
- liquidity or capacity falls;
- selected historical observations are repeated or reordered.
A macro scenario goes further by translating an economic narrative into market-variable changes. That translation is a model, not a discovered fact. “Inflation shock” has no unique equity, rate, currency, or volatility path.
Stress results should therefore be labeled by the imposed scenario, not mixed with historical resampling as though both estimate the same probability. Resampling and stress testing are not the same uncertainty statement: one redraws under a sampling rule, while the other asks about a deliberately specified change.
A comparison table
| Method | What changes | What remains from history | Main limitation |
|---|---|---|---|
| Independent bootstrap | Observation selection and order | Observed values | Breaks dependence |
| Block/stationary bootstrap | Selection and block order | Values and local sequences | Requires block assumptions |
| Trade-order permutation | Order of completed trades | Same trade outcomes | Does not rerun strategy decisions |
| Parametric simulation | Values generated by a fitted model | Estimated parameters | Model can miss tails and regimes |
| Deterministic stress | Declared adverse assumption | Everything not stressed | Severity and mapping are judgment |
| Historical replay | A selected historical interval | Recorded path under available data | One episode, possibly different market structure |
Read distributions, not only the median
Useful summaries include:
- 5th, 50th, and 95th percentile ending outcomes;
- probability of loss under the simulated procedure;
- drawdown and recovery distributions;
- losing-streak length;
- ruin or margin-breach frequency under a defined boundary;
- sensitivity to method and block length.
These are conditional probabilities: “under this resampling or simulation procedure,” not unconditional forecasts of the future.
More simulations reduce numerical noise, not assumption risk
Running many more paths can make the estimated percentiles more stable for the same generator. It does not make the generator more realistic. A precisely estimated percentile from independent normal returns can still be the wrong answer for a strategy with clustered volatility, overlapping positions, or liquidity-dependent losses.
Report the number of paths and random seed for reproducibility, then vary the assumptions that matter: resampling unit, block length, fitted distribution, dependence model, costs, and stress severity. Variation across defensible generators is often more informative than another decimal place from one of them.
A worked interpretation
Illustrative example. Suppose the historical run has a 12% maximum drawdown. A block-bootstrap distribution shows a median simulated maximum drawdown of 15% and a 95th percentile of 28%.
The correct interpretation is that rearranging observed dependent blocks under the chosen method often produces worse paths than the realized ordering. It is not proof that 28% is a worst-case limit or that there is exactly a 5% chance of exceeding it in live trading. Different blocks, costs, regimes, or unseen events can change the distribution.
Common uncertainty mistakes
- Treating bootstrap paths as independent future forecasts.
- Shuffling individual observations when dependence is central.
- Calling a trade reordering a price-path simulation.
- Hiding the assumed distribution behind a fan chart.
- Mixing a deterministic stress with a probabilistic percentile.
- Reporting only the median path.
- Assuming historical resampling includes unseen crises.
- Using a scenario name without specifying the market-variable changes.
Further reading
- Efron, “Bootstrap Methods: Another Look at the Jackknife” (1979) — Introduces bootstrap resampling as a way to approximate a statistic’s sampling distribution from observed data.
- Politis and Romano, “The Stationary Bootstrap” (1994) — Develops random-length block resampling for weakly dependent stationary observations and makes the dependence assumption explicit.
- Glasserman, Monte Carlo Methods in Financial Engineering (2003) — Provides an advanced treatment of financial sample-path generation, simulation accuracy, and the model assumptions behind synthetic outcomes.
- Basel Committee on Banking Supervision, Stress Testing Principles (2018) — Sets out objectives, methodology, documentation, and governance for scenario-based stress testing; its institutional context differs from a strategy backtest, but its scenario-design discipline remains relevant.