A strategy changes when its orders become large
Market impact is the price change associated with demanding liquidity. A small market order may execute near the best quoted price. A large order can consume several price levels, reveal continued demand, and induce other participants to adjust their quotes.
Turnover measures how much the portfolio trades as positions change. Capacity asks how much capital the strategy can deploy before trading costs, impact, limited opportunities, borrow, or risk constraints materially damage the result.
A backtest cannot be scaled by multiplying every position while leaving the fill prices unchanged. The return percentage may appear constant on paper, but the market interaction is not.
Why impact grows with size
Available liquidity is finite and distributed through time and price. Larger or more urgent orders take a greater share of it. Other participants may infer information from persistent demand and move their quotes.
Empirical impact is often concave: doubling size does not necessarily double impact. That does not imply unlimited capacity. The calibration varies across instruments, venues, volatility states, and execution horizons, and very high participation can move outside the range where an estimated curve is credible.
A commonly studied approximation expresses impact in return units as:
is order quantity, is comparable market volume over the execution horizon, is volatility over a matched horizon, and is an empirical coefficient. The square root is a model shape, not a universal calculator. Volume definition, participation, urgency, order sign, and calibration sample still determine whether the estimate is useful.
Impact also has temporary and persistent components. Some price pressure reverses as liquidity replenishes; some reflects information or lasting repositioning. A cost model should not claim more precision than the data supports.
Impact is not every price move after an order
Illustrative example. Suppose a buy order is followed by a 20-basis-point price rise. Several forces may be mixed together:
- the order consumed available offers;
- other participants inferred information from the demand;
- the same information that motivated the order moved the wider market;
- an unrelated market event arrived during execution; or
- the strategy intentionally traded while price was already moving.
Implementation shortfall observes the combined outcome relative to a benchmark. Market impact is the narrower counterfactual question: how would the path have differed without this order? That counterfactual is not directly observed. Impact estimates therefore rely on matched orders, models, experiments, or careful conditioning rather than labeling the whole post-order move as self-caused.
This distinction matters for capacity. A model that attributes ordinary signal movement to impact will understate scale; a model that attributes self-induced movement to alpha will overstate it.
Turnover connects the signal to liquidity
Two strategies with the same gross Sharpe can have radically different capacity. A monthly portfolio that changes 10% may tolerate much more capital than an intraday strategy that replaces its position repeatedly.
Turnover can be reduced through slower rebalancing, wider thresholds, buffered portfolio membership, or netting across strategies. Each modification changes the strategy and should be compared with the original signal rather than presented as free execution improvement.
The inputs to a capacity analysis
| Input | Examples | Why it matters |
|---|---|---|
| Order size | Shares, contracts, notional, volatility risk | Connects capital with market demand |
| Liquidity | Volume, quoted depth, spread, time-of-day pattern | Defines available execution opportunity |
| Participation | Order as share of relevant volume | Makes size comparable across markets |
| Horizon | Seconds, session, or several days | Trades urgency against risk |
| Impact curve | Calibrated functional form and uncertainty | Converts size into expected cost |
| Opportunity | Number and size of signals | Can cap capital before impact does |
| Constraints | Borrow, position, margin, concentration | Limits implementable scale |
| Capacity criterion | Net return, break-even, risk, participation | Defines “too large” |
Average daily volume is not enough for an order that must trade in ten minutes. Use the liquidity available during the actual execution window.
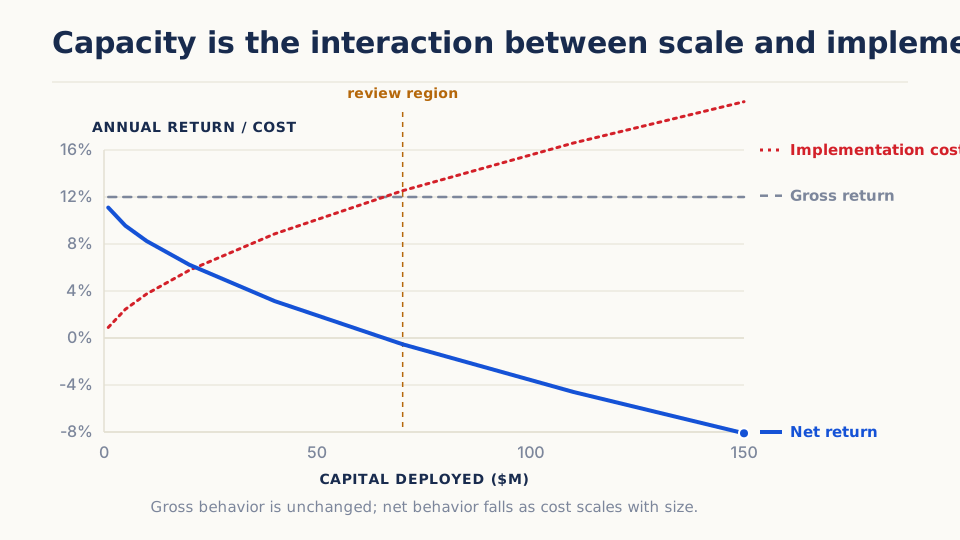
An illustrative capacity curve
Illustrative example. Assume a strategy earns 40 basis points gross per monthly rebalance at its current design. At a small capital level:
- fees and spread cost 5 basis points;
- estimated impact costs 2 basis points; and
- net edge is 33 basis points.
At ten times the capital, spread and fees may remain 5 basis points while impact rises to 15. Net edge falls to 20 basis points. At fifty times capital, modeled impact might exceed 40 basis points and the strategy reaches break-even.
This is a sensitivity curve, not a universal law or historical result. A real analysis recomputes each historical order using instrument, timestamp, size, volume, volatility, and execution window. It also brackets the impact model rather than reporting one precise capacity number.
Designing the study
- Convert every target-position change into timestamped orders.
- Apply explicit fees and spread.
- Estimate participation over the allowed trading window.
- Apply a calibrated impact range appropriate to each instrument and state.
- Repeat the portfolio at several capital levels.
- Recompute net return, risk, turnover, and any admission or position constraints at every level.
Report ordinary and stressed curves. Synchronized exits during volatility spikes can create much worse participation than average periods. Show concentration: one thin instrument may bind capacity even when the rest of the portfolio is liquid.
Capacity should be a range under assumptions, not a marketing maximum.
What else can bind before impact
- Too few opportunities to deploy additional capital.
- Short borrow availability and price.
- Futures position or margin limits.
- Portfolio concentration limits.
- A maximum acceptable holding period.
- Operational throughput or venue access.
- Risk limits that scale more slowly than notional.
The smallest binding constraint defines usable scale.
Important failure modes
- Current liquidity is used for older historical periods.
- Daily volume replaces liquidity in the actual execution window.
- One impact coefficient is applied to every market and state.
- Strategy-generated crowding and shared exits are ignored.
- Orders are scaled beyond the calibrated participation range.
- Capacity is reported from average cost while tail liquidation is unaffordable.
- Signal changes made to reduce turnover are not revalidated.
Further reading
- Kyle, “Continuous Auctions and Insider Trading” (1985) — Derives a foundational relationship between order flow, market depth, information, and price impact in a stylized auction model. It explains a mechanism rather than supplying an empirical capacity curve.
- Tóth et al., “Anomalous Price Impact and the Critical Nature of Liquidity in Financial Markets” (2011) — Develops a latent-liquidity explanation for concave, approximately square-root metaorder impact and provides supporting empirical evidence. The result does not imply one universal coefficient across markets or participation ranges.
- Almgren et al., “Direct Estimation of Equity Market Impact” (2005) — Estimates impact using a large proprietary sample of institutional US-equity orders and relates it to size, duration, volume, and volatility. Its historical equity calibration should not be transferred mechanically to other instruments or periods.
- Frazzini, Israel, and Moskowitz, “Trading Costs” (2018) — Studies $1.7 trillion of executions across 21 developed equity markets and examines how realized cost changes with trade and security characteristics. It remains a working paper based largely on one manager’s proprietary execution process.